
Drivers of Political Change: A Segment Analysis
Environics Analytics is uniquely positioned to shed some light on the answer through the lens of our PRIZM5 segmentation system. PRIZM5 classifies Canadians into 68 lifestyle types at the six-digit postal code level, providing rich descriptions of their demographics, locations, attitudes, behaviours and media use. You may have seen PRIZM5 on election night during the CTV broadcast with news anchor Kevin Newman where I was providing some insight into voters in selected ridings. You can see the clips here if you missed them.
This post offers a first cut of the analysis: the “circumstantial evidence” on who turned the election based on the preliminary data released by Elections Canada at the riding level. Next year, when the more granular poll-level results are available, we will be able to provide more precise answers. But this first look allows us to answer the question, “Which PRIZM segments were present in the ridings that changed party allegiance?” As you’ll see, some of the results are quite illuminating.
How Many Voters Lived in Ridings that Changed Party Allegiance?
The table below shows the percentage of voters living in ridings changing party allegiance from the 2011 to 2015 elections*. Over half (52.4%) live in ridings that switched parties. A large proportion of those eligible voters (47.6%) live in ridings that switched to the Liberal Party. Put another way, nearly half the country’s eligible voters live in ridings that switched to the Liberals in this election. That’s not to say that half of voters supported the Liberals, just that they live in what we will call “Liberal Conquest” ridings. Of those 47.6% of eligible voters in these ridings, it’s split roughly evenly between ridings that switched from the Conservative Party and those from the New Democratic Party.
If we look at the other half of voters living in stable ridings, about one-quarter (26.9%) live in ridings that remained Conservative, and only about one-tenth each live in ridings that remained NDP (10.9%) or Liberal (9.4%).
|
DISTRIBUTION OF CANADIAN CITIZENS18+ BY RIDING'S PARTY ALLEGIANCE 2011 VS 2015 |
|||||
| 2011 ELECTION | |||||
| CON | LIB |
NDP | GRN | ||
| 2015 ELECTION |
CON | 26.9% | 0.0% | 2.2% | 0.0% |
| LIB | 24.4% | 9.4% | 23.2% | 0.0% | |
| NDP | 2.7% | 0.0% | 10.9% | 0.0% | |
| GRN | 0.0% | 0.0% | 0.0% |
0.3% | |
*Note: We used Environics Analytics’ 2015 DemoStats estimates of Canadian citizens 18+ for this analysis, which would differ slightly from Elections Canada’s counts of registered voters. Data for 2011 are based on final general election results and do not take into account by-elections or candidates changing party allegiance post-election.
So Who Drove the Shift to the Liberals?
As I mentioned in the introduction, we can’t answer this question definitively with the data we currently have, but we can see which voter segments likely played the biggest role and then refine the story in the coming weeks with more data.
To do this analysis, we identified PRIZM5 segments with the greatest proportion of voters present in Liberal Conquest ridings as an indicator of which voter segments most likely made a significant shift to the Liberals. The results are telling.
The table below shows the PRIZM5 segments with more than two-thirds of all eligible voters in each segment nationally living in a Liberal Conquest riding.
| % OF ELIGIBLE VOTERS LIVING IN A LIBERAL CONQUEST RIDING (BY PRIZM5 SEGMENT) |
||
| PRIZM5 Segment |
% Voters |
|
| 20 | South Asian Achievers |
94.4 |
| 25 | South Asian Society |
81.4 |
| 30 | La Vie est Belle |
79.3 |
| 21 |
Beau Monde |
78.3 |
| 07 |
Nouveaux Riches |
75.7 |
| 27 |
Diverse City |
74.6 |
| 45 |
Jeunes d'Esprit |
72.9 |
| 15 |
Heritage Hubs |
71.1 |
| 62 |
Terre à Terre |
70.7 |
| 28 |
Metro Multiculturals |
69.6 |
| 43 | Newcomers Rising | 68.7 |
A couple of important patterns emerge:
- Multicultural Voters
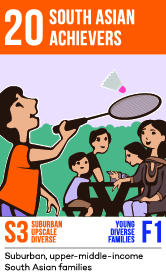
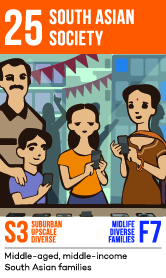
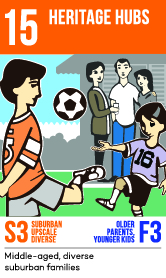
Topping the list of segments that had the greatest share of eligible voters living in Liberal Conquest ridings were several segments with a large presence of South Asians. In PRIZM5’s upper-middle-income suburban South Asian segments – South Asian Achievers and South Asian Society – almost all eligible voters (94.4% and 81.4%, respectively) live in Liberal Conquest ridings. And it doesn’t stop there: other segments with large numbers of South Asians are also on the list, including Diverse City, Heritage Hubs and Newcomers Rising. Given these numbers, I’d be very surprised not to see at least some segments of South Asian voters playing a significant role in the Liberal gains.
I should also note two other segments that show up on the list: Diverse City and Metro Multiculturals, which are associated with the Little Italys , Little Portugals, Greektowns and other southern and eastern European immigrant neighbourhoods around the country. These are areas that still hold the flavour of European immigrants from the 1950s to 1990s, but have become more culturally diverse and gentrified over the years, and have attracted residents of Latin American, Arab and Vietnamese heritage, among others. These PRIZM segments also had a large majority of their voters living in ridings that switched to the Liberals.
Finally, it’s interesting to note a large multicultural group that is not represented heavily in this list: voters of Chinese heritage. There could have been some changes in voting patterns, but PRIZM5’s heavily Chinese segments, like Asian Sophisticates and Asian New Wave, are not at the top of the list. Only about half of voters in those segments live in Liberal Conquest ridings, so we will have to look at their voting patterns when more detailed data is available to understand what happened to their vote. But it’s likely that they played a smaller role in the shift to the Liberals.

- Francophone Families
We know that Quebec played an important role in the Liberal win after voting heavily NDP in 2011, but when we examine the PRIZM segments that had the greatest proportion of voters in Liberal Conquest ridings, there is a distinct pattern that looks to be driven by lifestage: all of the Francophone segments in our list come from the Midlife Quebec Families lifestage group of PRIZM segments. These voters are middle- to late-middle-aged couples or families with teenagers living in a variety of contexts (from urban to rural) in Quebec, and across a range of incomes.




I look forward to examining the poll-level voting patterns once Elections Canada releases them and hope to shed more light on shifting voting patterns in what was truly a fascinating federal election.
###
Rupen Seoni is Senior Vice President and Practice Leader of the packaged goods, automotive, public sector and not-for-profit practice at Environics Analytics.


