


Canada's Immigration Trends and Impact on Economic and Demographic Growth
Canada’s long-term demographic and economic growth is heavily influenced by its population.
The latest Census shows that between 2016 and 2021, the number of people aged 85 and over has increased by 12% (Statistics Canada). For many years now, we have been aware that Canada’s population is aging. Canada’s economic growth, labour force participation, health services, housing, transportation and consumer expenditure are increasingly impacted by this demographic shift.
As such, Canada relies heavily on immigration to mitigate the effects of the aging population.
Recently, Immigration, Refugees and Citizenship Canada (IRCC) announced ambitious immigrant targets for the next 3 years, amounting to approximately 1.3 million people, at an average of about 443,000 per year. Our newest dataset – NewToCanada – helps organizations across Canada better understand this important segment of our population.
National trends
With the exception of 2020, the total number of newcomers increased between 2016 and 2021 in Canada for both permanent (PR) and non-permanent residents (NPR). * Over this period, permanent residents increased by 37% and non-permanent residents increased by nearly 60%, with decreased activity in 2020 due to the global pandemic and related travel restrictions.
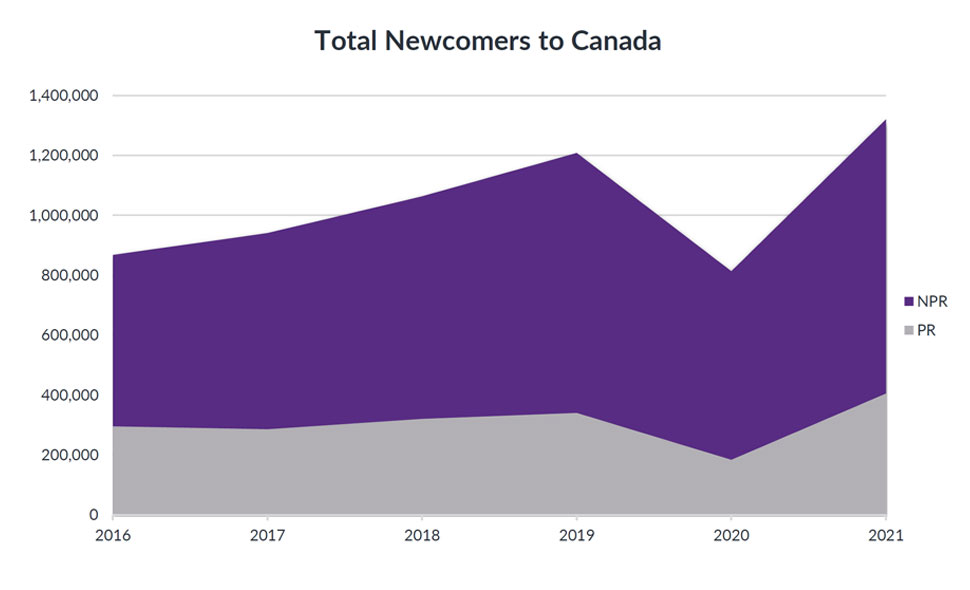
Pictured above: Trends of total number of newcomers to Canada, permanent residents vs. non-permanent residents (2016 to 2021).
Most permanent residents in Canada arrived through the economic stream (59%), followed by sponsored families (26%) and resettled refugees and protected persons (15%).
Permanent residents between the ages of 15 and 44 make up over three-quarters (76%) of all incoming permanent residents, indicating the prime labour force years.
Among non-permanent residents, nearly half arrived on study permits, followed by international mobility programs and temporary foreign worker programs.
Provincial trends
The number of newcomers varied significantly by region.
Ontario is the most chosen destination province for all newcomers, and the gap between Ontario and other provinces widened between 2016 and 2021.
BC, Quebec and the Prairies also attracted a significant number of migrants, with Alberta having the highest proportion among the Prairie provinces.
Although fewer migrants chose the Atlantic provinces, their numbers increased steadily in this period, mostly driven by Nova Scotia and New Brunswick. In addition to Canada’s Express Entry and Provincial Nominee Program, the Atlantic provinces attracted newcomers through the Atlantic Immigration Program, which is a pathway to permanent residence.
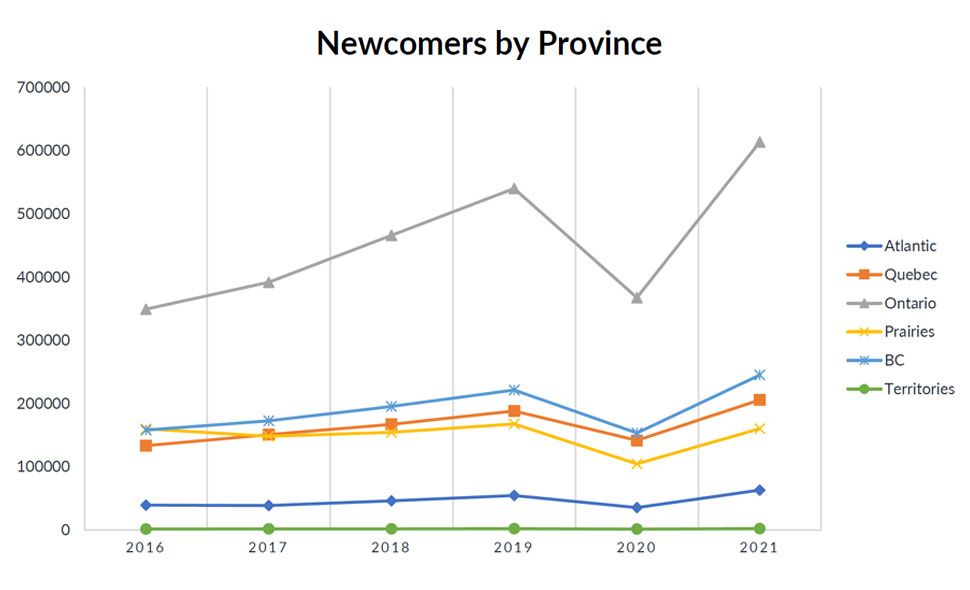
Pictured above: Line graph showing trends of number of newcomers to Canada by province (2016 to 2021).
The proportion of permanent vs. non-permanent residents also varied by region.
Regions with the highest proportion of non-permanent residents include BC, Quebec and some of the Atlantic provinces, with Newfoundland and Labrador having the highest proportion (77%).
The Prairies and Northern Canada have the highest proportion of permanent residents, with Saskatchewan, Alberta, and the Territories having the highest proportion.
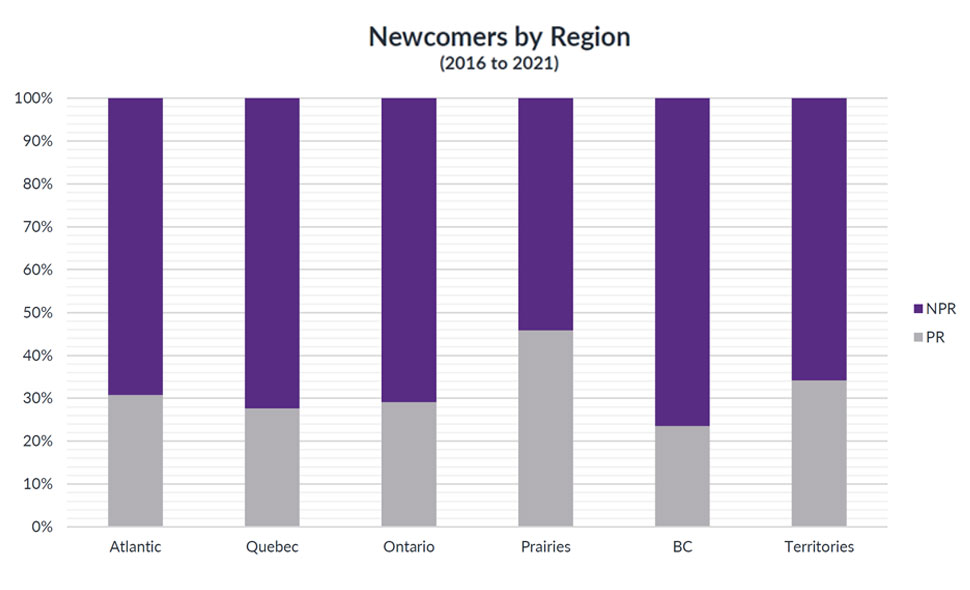
Pictured above: Stacked bar graph showing percentage of permanent residents vs. non-permanent residents by region in Canada.
Mapping immigration: EA’s NewToCanada dataset
EA’s NewToCanada dataset captures these Canadian immigration trends by country and region of origin.
Available at the dissemination area level, users can quantify permanent and non-permanent residents, discover what country or region of the world residents are coming from and identify where in Canada they are settling.
Apart from Ontario being the most preferred choice for settlement due to economic and diverse opportunities, there are high proportions settling in various parts of the country, and not only in the large urban centres such as Toronto, Montréal and Vancouver.
The table below shows the top 3 Census Subdivision destinations. Included are some of the larger CSDs, those with a population of 100,000 people or more.
Both permanent and non-permanent residents are choosing cities such as Brampton and Cambridge (ON), Red Deer (AB), Saanich and Surrey (BC); and Sherbrooke (QC) as their destination cities.
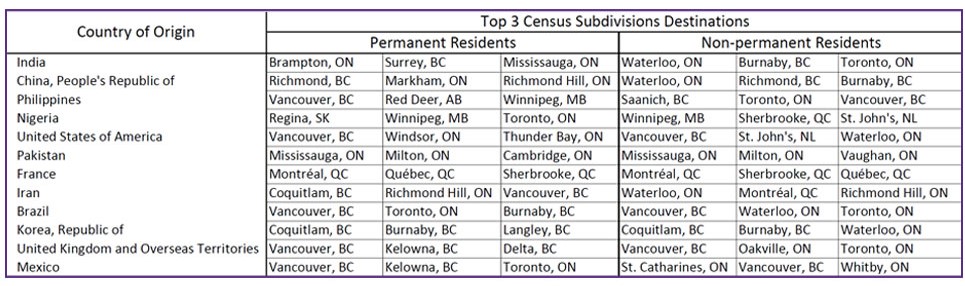
Pictured above: Table showing countries of origins of new residents in Canada and the top 3 census subdivision destinations where they are settling.
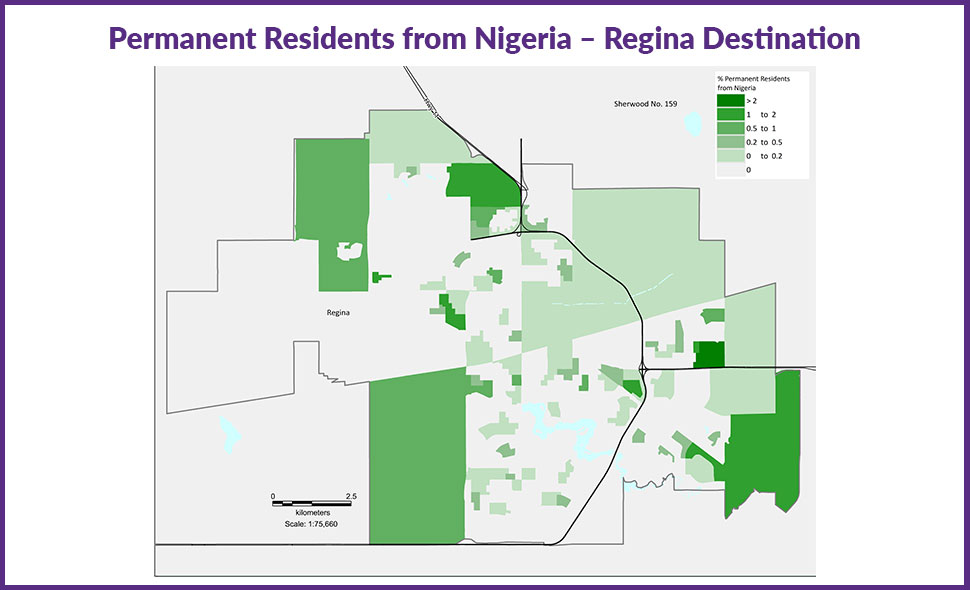
Map 1
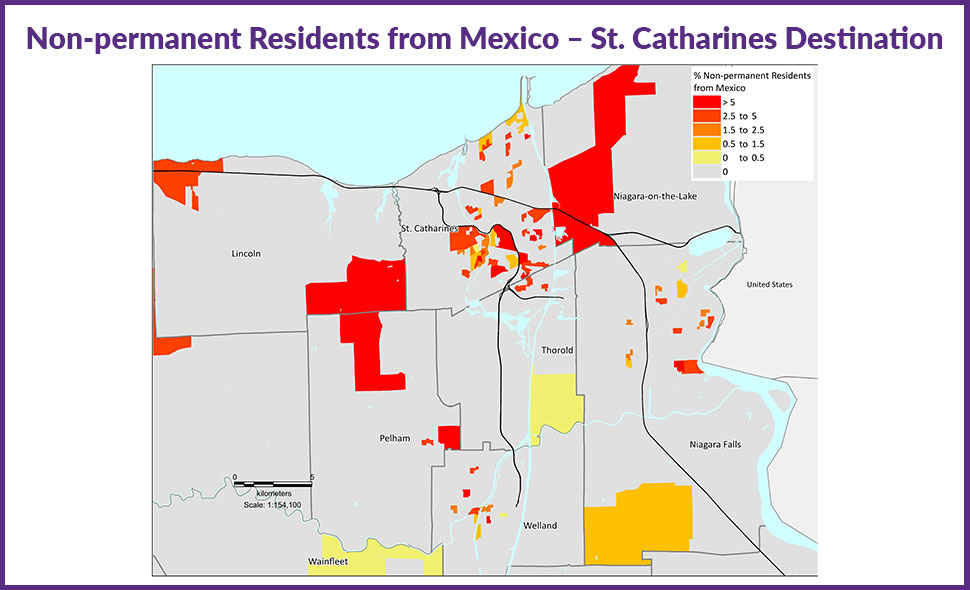
Map 2
Related Content
Learn more about Demographic Data
* Permanent residents (PR) are defined by the month/year in which permanent residency was granted and non-permanent residents are defined by the month/year in which the permit became effective.