New research reveals what Canadians are really buying online
Toronto, November 26, 2018 – As consumers hunt for deals on Cyber Monday, new research by Environics Analytics and J.C. Williams Group reveals what Canadians really want to buy online. Although the dollar value of what Canadians spend online is consistent across the country, the composition of those purchases can vary considerably between consumer segments.
Environics Analytics’ newest data product, ClickSpend™ Powered by J.C. Williams Group, is the first database that will allow retailers and shopping centre developers and owners to analyze the online and in-store shopping habits of consumers across 14 broad spending categories, including clothing, health products and food. Environics Analytics models the survey estimates down to small areas of geography to provide actionable insights about online shopping expenditures by neighbourhood to help the retail sector track market share and identify online and offline opportunities.
“For the first time in Canada, brick-and-mortar retailers will be able to assess the opportunity and potential competitive threat posed by online channels and shifting shopping habits,” says Michele Sexsmith, Senior Vice President and Practice Leader for Retail, Real Estate, and Entertainment at Environics Analytics. “ClickSpend allows retailers to identify the impact of e-commerce on local real estate and marketing decisions to meet changing consumer expectations.”
ClickSpend reveals notable differences between cities and neighbourhoods. Although households in Quebec City and Winnipeg each spend approximately $2,500 a year online, their virtual shopping carts are very different. Households in Quebec City tend to buy more food and groceries online, while Winnipeg households are more likely to buy recreational gear online. There are strong differences within communities, too. In Toronto, online purchases of electronics are concentrated in suburbs like Mississauga and Markham, but less so in Brampton and the city’s East-End Danforth area.
In conjunction with data from Environics Analytics’ suite of financial products, ClickSpend is derived from the Canadian E-tail Report, a semi-annual online survey conducted by the J.C. Williams Group. Estimates are produced using several cycles of the survey, encompassing more than 7,500 nationally representative respondents. The 14 spending categories captured by ClickSpend represent $343 billion in household expenditures (excluding services), with $41 billion of those purchases occurring online. The purchase categories covered by this database are a subset of the estimated $1.15 trillion that Canadian households are expected to spend this year.
Here are some of the other noteworthy findings from the ClickSpend 2018 release:
Who spends the most online?
The average Canadian household spends an estimated $2,748 a year buying goods online. Households in British Columbia spend the most online, with $3,369 annual purchases, while households in Quebec spend the least, with $2,236 annual online expenditures. Overall, 11.9 percent of all Canadian household expenditures tracked by ClickSpend happen online. Although the differences in online expenditures between provinces seem small, ClickSpend finds that there are distinct differences between regions, cities and consumer segments.
For instance, households in Saskatchewan are more likely to buy health and beauty products online (20 percent of purchases in that category), whereas residents in Ontario are more likely to buy apparel online (28 percent of purchases in that category). In contrast, households in Quebec tend to have lower rates of buying apparel online (23 percent), but they are far more comfortable buying groceries over their smartphone, computer or tablet than any part of the country. More than 5.6 percent of all grocery purchases, including alcohol, in Quebec happen online, which is 20 percent higher than the national average. Saskatchewan spends the least on groceries online, at only 2.6 percent of all grocery and alcohol purchases.
The Variation is at the Category Level
Online Spending per Household by Umbrella Category, 2018

Segment Specific spending preferences
What gets lost in the provincial numbers are the large differences that exist between the various consumer segments. We can divide the country into 68 PRIZM5 segments, collections of similar neighbourhoods. Of the 68 distinct PRIZM5 lifestyle types in Canada, eight segments stand out as being heavy online spenders. The households that make up these segments tend to be concentrated in urban areas and are usually comprised of wealthier, established families and younger, unattached Canadians.
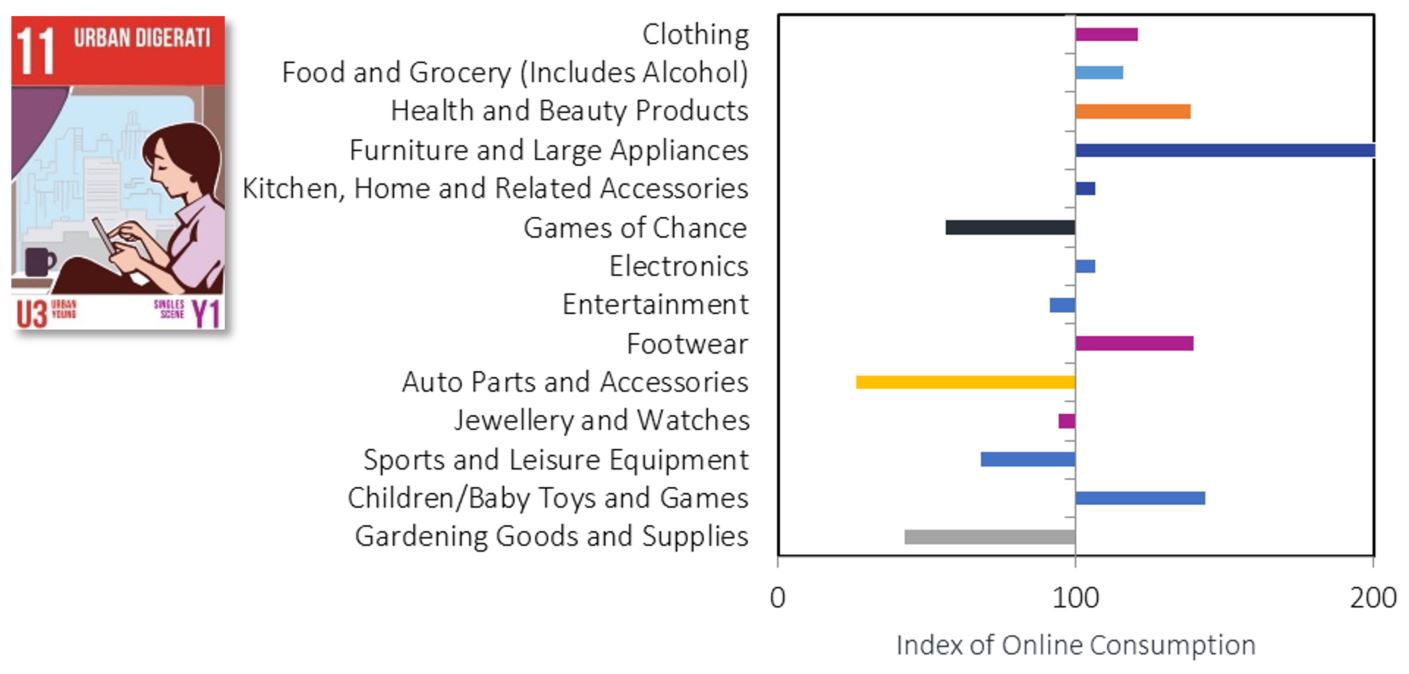
These differences are even more pronounced when you consider what individual consumer segments tend to buy online. As an illustration, consider the online spending habits for the Urban Digerati, Asian Avenues and Trucks & Trades PRIZM5 segments. While these three segments spend similar amounts online, there are significant differences in what they are buying.
For example, households belonging to the Urban Digerati segment, which is characterized by younger households with upper-middle-incomes, tend to buy furniture, health and beauty products as well as children’s toys and games online at above average rates. Conversely, this segment shows little interest in buying auto parts online, which may not be much of a surprise given they are much less likely to own a vehicle than the average Canadian household.
Asian Avenues, which have a high concentration of successful, middle-aged and older Asian families, tend to buy electronics, games of chance and footwear online at higher rates relative to the average household, but they show little interest in buying sports and recreational equipment this way.
Meanwhile, Trucks & Trades, which consists of upper-middle-income suburban families in places like Regina, St. John’s and Red Deer, Alta., appear comfortable buying just about anything online, especially when it comes to auto parts and sporting goods.


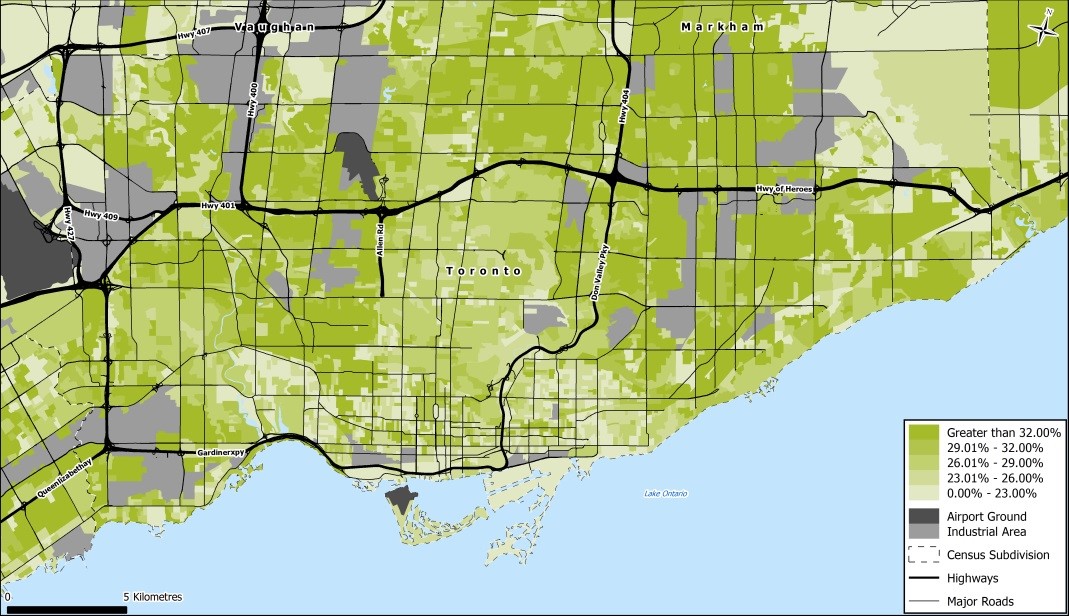
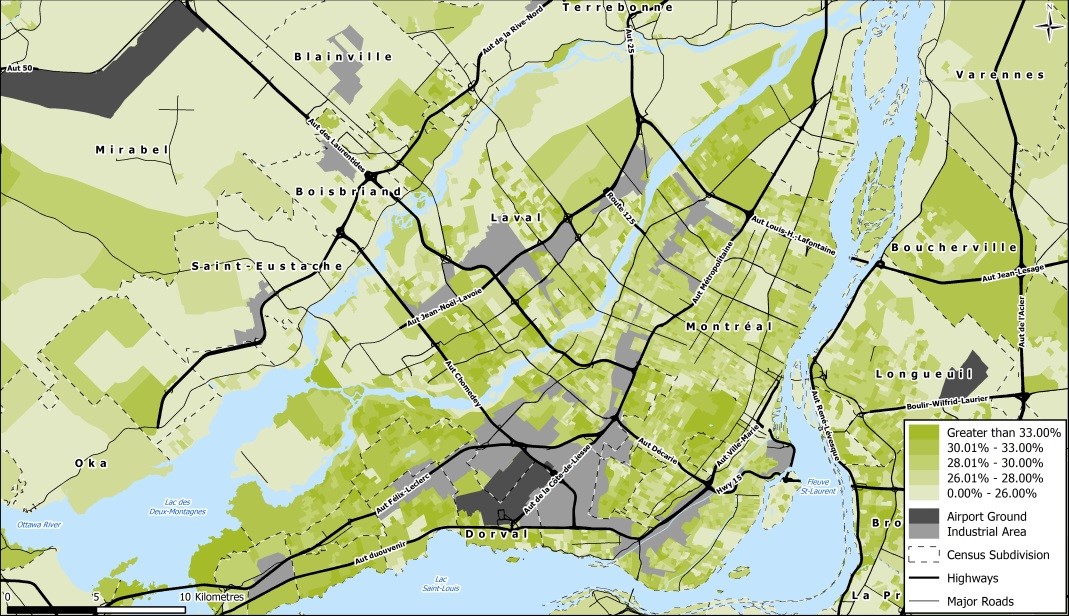
Due to the wide distribution of PRIZM5 segments across Canada, these variations can be clearly seen between neighbourhoods. In Toronto, areas that are most likely to buy electronics online are found outside the downtown core. It’s quite common to have areas with high rates of buying electronics online adjacent to neighbourhoods where residents would prefer to make these purchases in-store.
The story in Montreal is completely different, primarily because the Francophone population still displays an affinity for brick and mortar stores when looking for their newest electronics. The predominately French communities of Laval, Blainville and Mirabel particularly stand out given their low rates of online purchases in this category.
Share of Total Electronics Expenditure Spent Online, 2018
Toronto
Montreal
Challenges and Opportunities
Of the $41 billion Canadians are expected to spend online this year, an estimated $7.8 billion or 19 percent will be spent on apparel. More than 20 percent of all clothing purchases in Canada are expected to be made online; only children’s toys, jewellery, electronics and entertainment are bought online at higher rates. The real opportunity, however, may be in online grocery sales. While Canadians spend an estimated $6.4 billion a year on online groceries, these purchases represent less than five percent of the total household expenditure in this category and present an incredible opportunity for growth.
Groceries will be a category to watch, as grocery retailers are starting to make a more aggressive push into the online channel. This category could easily eclipse clothing if Canadians households respond to the increased offerings of online groceries.
Health and beauty products are another area that could see increased competition from online retailers. Canadians are projected to spend almost $6 billion in this category this year. While the large expenditure in this category suggests that consumers are already comfortable buying these products over the web, this represents only 13 percent of all purchases in this category.
Online Penetration by Category
Online Spend (L) and Online Spend Shares (R) ranked by Online Spend Share, 2018
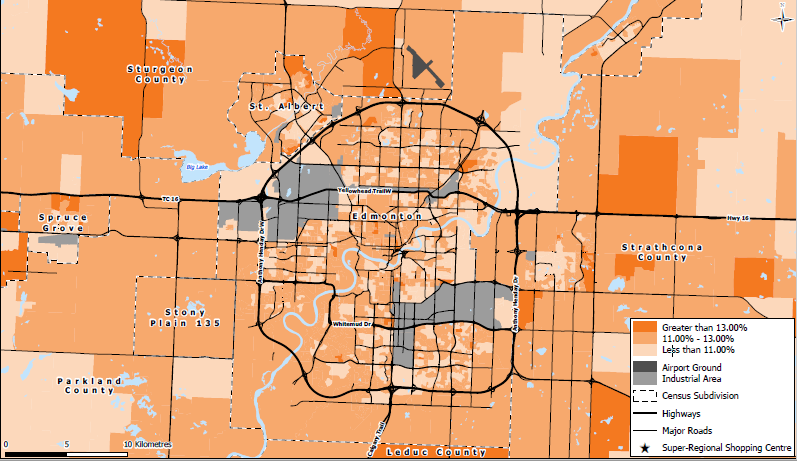
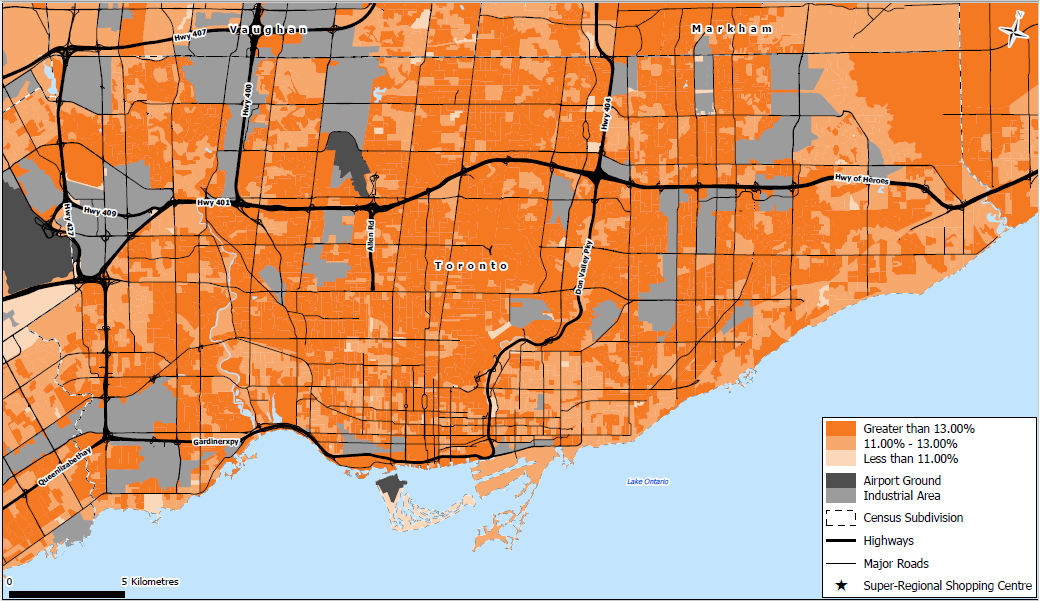
 While category specific retailers will want to compare the online and in-store market share for their product category, developers and retailers should pay close attention to the total online expenditure levels within a market. For instance, most of Toronto’s neighbourhoods exceed the average online spending share, whereas Edmonton has much lower levels.
Developers and retailers must consider these factors in order to grow their business in these areas. Brick-and-mortar retailers may need to change where they are located in neighbourhoods with high online purchase behaviour. New changes may include click-and-collect options, special in-store events and updated store layouts, as well as retrained sales associates and new technology to appeal to the changing consumer. Customer experience is key in these situations.
Comparing two contrasting markets
% of total expenditure that is online – by dissemination area
Edmonton
Toronto
About ClickSpend
Environics Analytics, the Toronto-based marketing and analytical services company, created ClickSpend in partnership with J.C. Williams Group to help retailers develop business strategies to withstand the competitive threat from online retailers and help online retailers find opportunities for growth. The ClickSpend database allows for many applications, including market sizing, consumer targeting, evaluating market share and identifying the interaction effect across channels.
ClickSpend is the first database in Canada that will allow retailers and shopping centre developers to adapt to shifting shopping habits by measuring the current performance to their product category by channel preference. The database contains 45 consumption estimates and insights for more than 800,000 postal codes.
Whether you are a brick-and-mortar retailer, a pure play e-tailer, or a marketing analyst who seeks to understand the omnichannel consumer ClickSpend will enable businesses in the retail sector to integrate their real estate, marketing and media strategy to align to a changing market.
For media inquiries, please contact us at 1.888.339.3304 ext. 2733 or via email at inquiries@environicsanalytics.com.
About Environics Analytics
Environics Analytics is the premier marketing and analytical services company in Canada. The company offers a full range of analytical services to help customers turn data and analytics into insight, strategy and results. Environics Analytics’ team of quantitative marketers, modellers and geographers are experts at helping organizations identify their business challenges, develop data-driven solutions and achieve success along every phase of their analytics journey. To learn more about Environics Analytics, please visit www.environicsanalytics.com.
About J.C. Williams Group
J.C. Williams Group is one of North America’s leading full-service retail and retail-related consultancies with over 40 years of industry experience. The consultancy offers its clients practical, creative, and in-depth knowledge of retailing and marketing, including up-to-date know-how and techniques to make retail operations better and more profitable. J.C. Williams Group has offices in Toronto, Montréal and Chicago.


