A Perspective on Household Debt in Canada
Despite the high Canadian household debt-to-income ratio, the interest cost of carrying this debt is only 2/3 of what it was before the financial crisis. Canadian households have been diligent with their debt and their interest-to-income ratio is relatively stable across the country. However, debt levels are elevated amongst optimistic outer suburb families.
After a hiatus of almost 10 years, the United States Federal Reserve has finally begun to raise its interest rates. On December 16th, the Federal Open Market Committee raised the Federal funds rate by 0.25%, revising the range to 0.25%-0.50%, and applied identical increases to both the interest rate on excess reserves and its rate on overnight reverse repurchase agreements. Just the day prior, the Bank of Canada published its financial system review highlighting the risk of a growing number of households with debt-to-income ratios over 350%. Both pieces of news prompted an immediate flurry of “what if interest rates go up” speculations in Canada, where the national household debt-to-income ratio has long been a topic of hot debate.
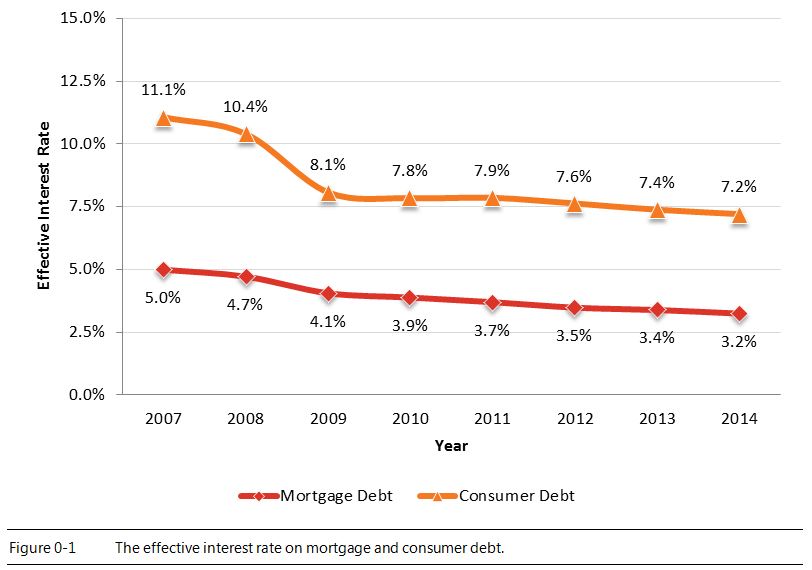
So, let’s put all of this news in a little bit of context. Using the National Economic Account data from Statistics Canada, we can calculate the effective interest rate (the ratio of interest paid to debt held) of Canadian households both for mortgage debt and consumer (or “non-mortgage”) debt. Following the unprecedented fiscal policy response to the financial crisis in 2008 the effective interest rate on both mortgage and consumer debt has dropped to historic lows. While the bulk of the decline in the effective interest rates were felt in 2009, the rates have declined steadily since 2009 as both risk premiums have declined and the full portfolio of debt (specifically the fixed rate portion) has been renewed under the new rate regime. Note that the Consumer Price Index grew at an annualized rate of 1.7% between 2006 and 2014 which has further reduced the “real” cost of the mortgage debt from 3.2% to 1.5%.
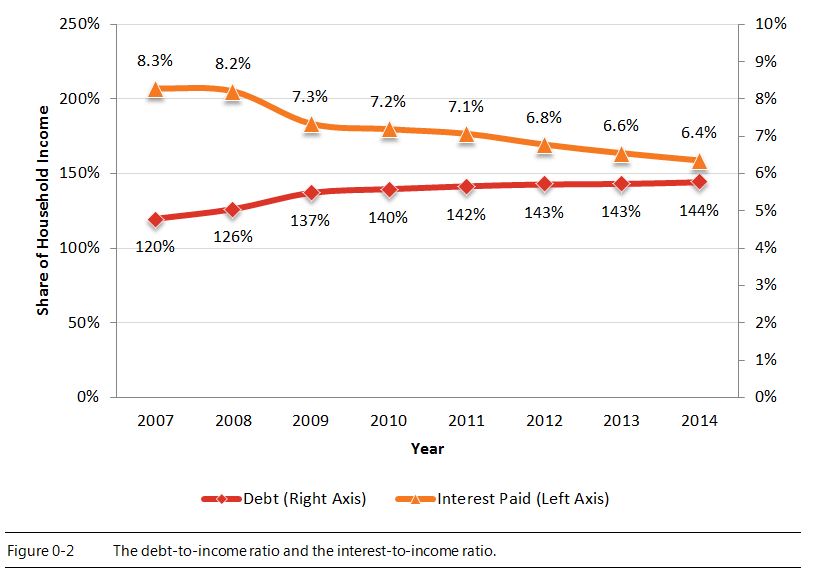
Looking at total household debt holdings, we can say, yes, total debt has increased faster than incomes. The debt-to-income ratio of Canadian households has grown from 120% in 2006 to 144% in 2014, although the bulk of this increase occurred prior to 2010. Since 2009 the debt-to-income ratio has grown by only 7%. While the debt-to-income ratio has increased since 2007, the interest-to-income ratio (the amount that households pay in interest divided by their total income) has declined from 8.3% to 6.4%. While household cash flows will be impacted by the additional principal repayments from higher debt levels, the reduced interest cost of this debt has allowed households to repay their existing debts faster. (Please note, we are using a Census definition of “total income” here which differs from the definition used in the National Economic Accounts, which is commonly cited by the Bank of Canada.)
So, hypothetically, if lending rates were to increase in Canada we would expect to see a gradual increase in the interest paid rather than a sudden jump as much of the debt is based on fixed-rate contracts which renew at regular intervals. A portion of the rapid decline in effective interest rates in 2009 involved households breaking their mortgages to refinance at the lower rates and will likely not occur as interest rates rise. Additionally, there is a lag between when interest rates are revised and when they become implemented. As seen with the history of effective interest rates between 2007 and 2014, any change to the interest rates will not instantly affect the effective interest rates but rather will be factored in over time. Finally, as the effective interest rates have fallen significantly over the past couple of years, there would need to be a relatively large increase in interest rates to return the interest-to-income ratio to pre-crisis (2007) levels.
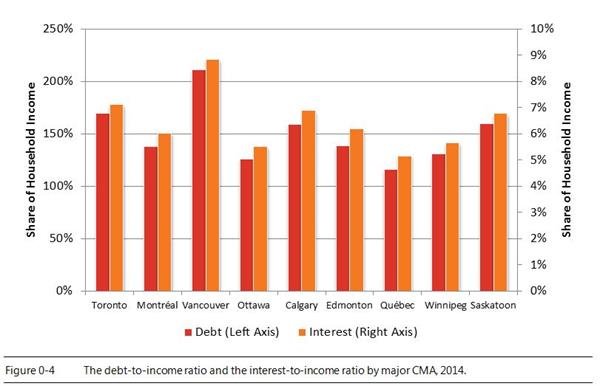
Despite an overall picture of decent household balance sheets, sub-nationally there are some variations. Households in British Columbia, and particularly in Vancouver, have well above average debt-to-income ratios and interest-to-income ratios. This makes this group of households particularly sensitive to potential interest rate changes with a quarter percent rise in interest rates swallowing up about 0.6% of their total income.
With their lower interest-to-income ratios, Manitoba and Quebec would only see about 0.4% of their total income swallowed up by a quarter percent rise in rates. One of the greatest risks when taking about financial stability is where the debt tends to be concentrated in specific pockets, whether demographic or geographic in definition. While British Columbia does tend to have the highest ratio of debt-to-income, the ratios of the other provinces tend to be relatively evenly distributed. At the city (CMA) level, it is no surprise that Vancouver, Toronto and Calgary all have higher debt-to-income and interest-to-income ratio given their relatively expensive real estate markets; however, outside of Vancouver this variation is still not dramatically different from the national mean.

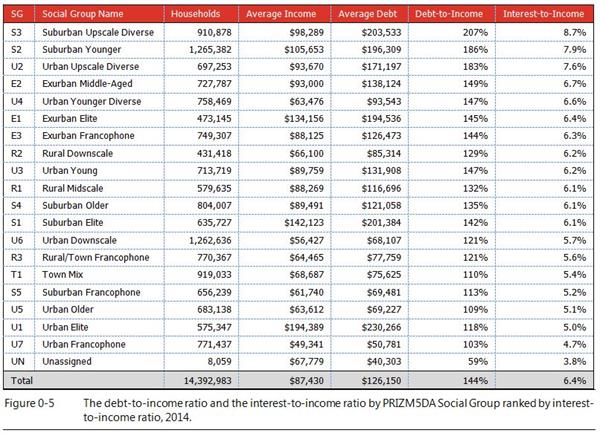
Of course, not all communities and neighbourhoods within these provinces and cities are equally sensitive to interest rate shifts. By looking at Canadian neighbourhoods through the lense of PRIZM5, Environics Analytics consumer segmentation system that classifies Canadians into distinct lifestyle groups, we can group the 68 segments into 20 relatively homogenous Social Groups.
- The Suburban Upscale Diverse (S3) group has both the highest debt-to-income ratio as well as the highest interest-to-income ratio of all of the Social Groups. These neighbourhoods are the home of highly educated, multigenerational, above average income, diverse families. These neighbourhoods can be commonly found in outer suburbs like the 905 region of Toronto.
- The group with the second highest debt-to-income and interest-to-income ratio is Suburban Younger (S2). While these neighbourhoods are also the home of suburban families, these areas tend to be found on the edge of urban development and have younger school-aged children at home. Like S3, S2 is also educated and has above average incomes and both sets of families expect their economic prospect to continue to improve in the future.
- The last group of high debt-to-income households is Urban Upscale Diverse (U2). The families in these neighbourhoods tend to have slightly lower incomes than the two previous suburban Social Groups, are both culturally and educationally diverse, and tend to have adult children living at home.
Using PRIZM5, we can link these 3 groups to psychographic data from Environics Research’s Social Values survey. Perhaps tellingly, these three groups all have a strong belief in the “Primacy of the Family” (centrality of family; making personal sacrifices and providing for one's family over all else), the “North American Dream” (the belief that, like the United States, Canada is a “land of opportunity” and that anyone can make it, and make it big, if they try hard enough), and “Personal Challenge” (setting difficult goals to achieve, even if just to prove to themselves that they can accomplish them). For these households, debt may simply be seen as a challenging stepping stone on the way to great things. Either way, the trial of debt is immaterial relative to the desire to provide for their families.
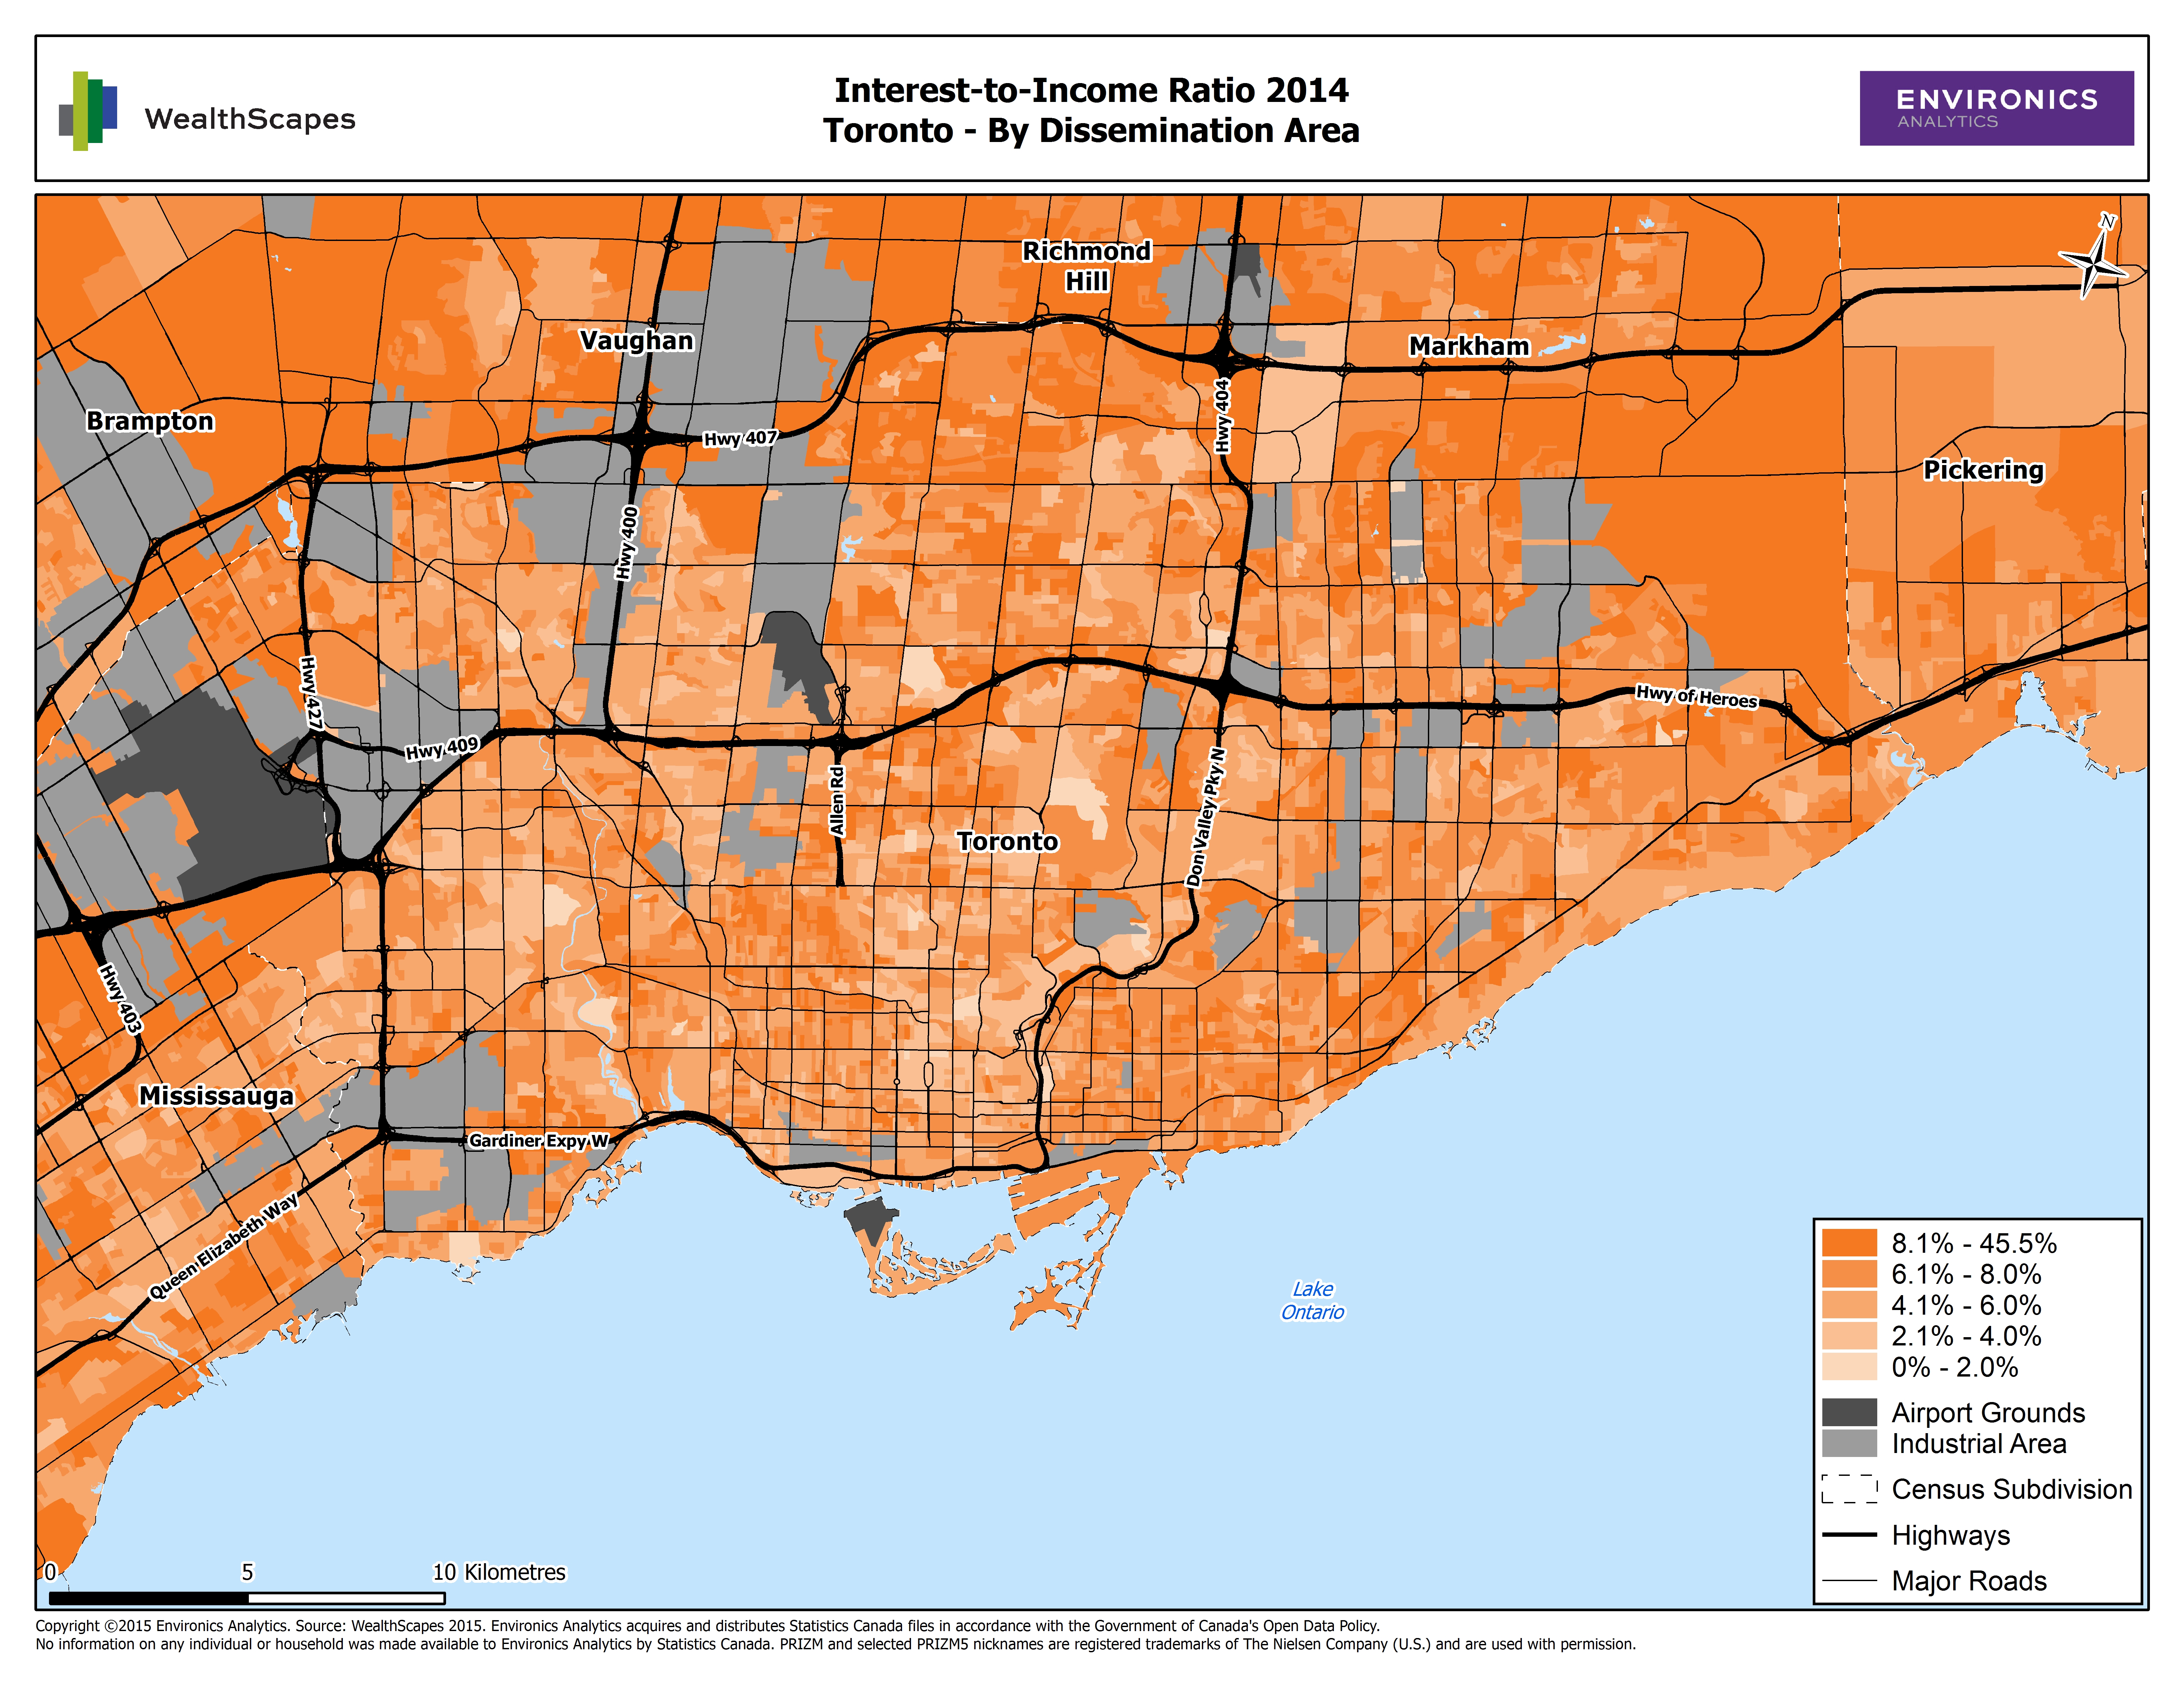
While examining the debt loads of Social Groups can reveal demographic pockets of high debt, it is possible to also look at the debt holdings spatially at the dissemination area level. The pattern across the cities is relatively uniform in which the younger and newer neighbourhoods mostly comprised of homeowners tend to have the highest debt-to-income ratios. Many of these areas have proven attractive to younger families who are willing to borrow above their current means as they expect that their income growth will enable them to afford the houses into which they have settled. Vancouver is an exception here. Due to geographical constraints and economic and population pressure Vancouver is a very expensive real estate market and this has translated into higher interest-to-income ratios across the whole of Greater Vancouver.
Click maps to enlarge
Fortunately, this entire study has been purely hypothetical. Since the July 15th overnight rate reduction to 0.5%, the Bank of Canada has hinted at no intentions towards raising its interest rates. In fact, observers have been divided on whether or not the Bank of Canada will actually reduce its overnight rate to 0.25% in the coming months. Should Canadian debt interest rates increase, as some observers are predicting for 2017, it will most likely be a slow and gradual process. A return to “normal” interest rates will be a drag on other household spending; however, the average debt growth per household has been quite stable over the last 5 years relative to household income growth. This suggests that Canadian households have been diligent with their debt even while the Millennials have entered their family formation (and home buying) years.
In its financial system review, the Bank of Canada highlighted three major sources of risk to the financial system:
- A sudden increase in global lending rates
- A continued sag in commodity prices
- Prolonged downturn in emerging-market economies (especially China)
Any of these risks are liable to trigger a decline in Canadian incomes, a far more daunting prospect. As a whole, Canadian households have been careful to avoid taking on too much debt relative to their incomes. Perhaps we should pay more attention to the income side of the equation.
—Peter Miron


