The Buzz on the Cell Phone Market
At one time or another, we’ve all experienced frustration with our cell phone providers. It’s easy to get discouraged while trying to navigate the different rate plans, leaving you to wonder why companies don’t offer the same rates to everyone. Your buddy Joe in accounting has a great rate, so why can’t you get the same deal? Even after spending hours on the phone with the customer service department, they still won’t match Joe’s rate. While we may never know the secret to getting a particular cell phone rate, there’s plenty of information available to help marketers, retailers, service providers and curious consumers understand how much Canadians are spending on their cellular services and what drives the current mobile market.
According to Environics Analytics’ (EA) recently-released HouseholdSpend database (which provides current estimates of annual expenditures for most goods and services used by Canadians), the average Canadian household will spend $986 in 2016 on their cell phone services. With households earning an average of $95,144 annually, that means cell phone services eat up about 1 percent of those earnings—similar to the proportion spent on restaurant lunches or electricity for principle residences.
Because we know that not all Canadians want the same things from their mobile provider, and not all cell phones plans are alike, let’s look at some factors that explain just how much Canadians are willing to shell-out for their cell phone services.
Cell phone services spending, a regional profile
In provinces where there’s more competition in the mobile market—Saskatchewan and Manitoba, for example—rate plans tend to be cheaper. But do these cheaper plans mean households in those areas end up spending less on cellular services? Not really. Compared to the national average, Quebec and the Maritime provinces tend to spend the least, while Alberta and the Territories spend the most on their cell phone services.

We also looked at urbanity as it relates to cell phone spend. We found that while residents in urban areas tend to spend more in absolute dollars on their cellular service, people in rural areas actually spend a slightly higher proportion of their incomes on cell phone services.

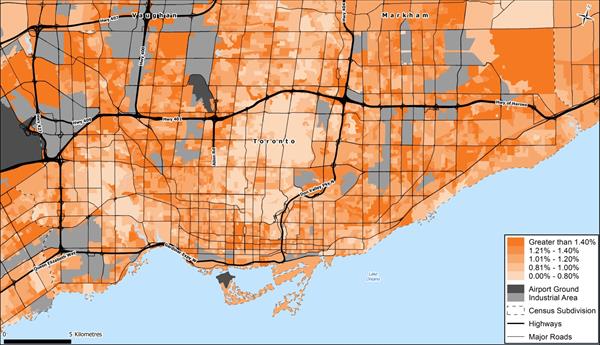
Cell phones today are no longer luxury items; they have become a necessity. Perhaps surprisingly, a geodemographic-based examination of cell phone service spending as a share of household income in Toronto reveals that the cellular spending-to-income ratio is larger in areas with lower incomes. This is not to say that higher income areas are not spending more, but rather that even residents in Toronto’s lowest-income neighbourhoods are reluctant to forgo the modern convenience of cell phones. And the same story plays out in other cities across the country.

As you might expect, in areas where households are more likely to have a landline, annual cellular expenditures are lowest. But what other factors affect cellular spending? Does the type of phone or the service provider play a role? By examining EA’s Opticks Mobile powered by AskingCanadians™ (an online survey-based database on mobile usage), we can shed light on these questions.
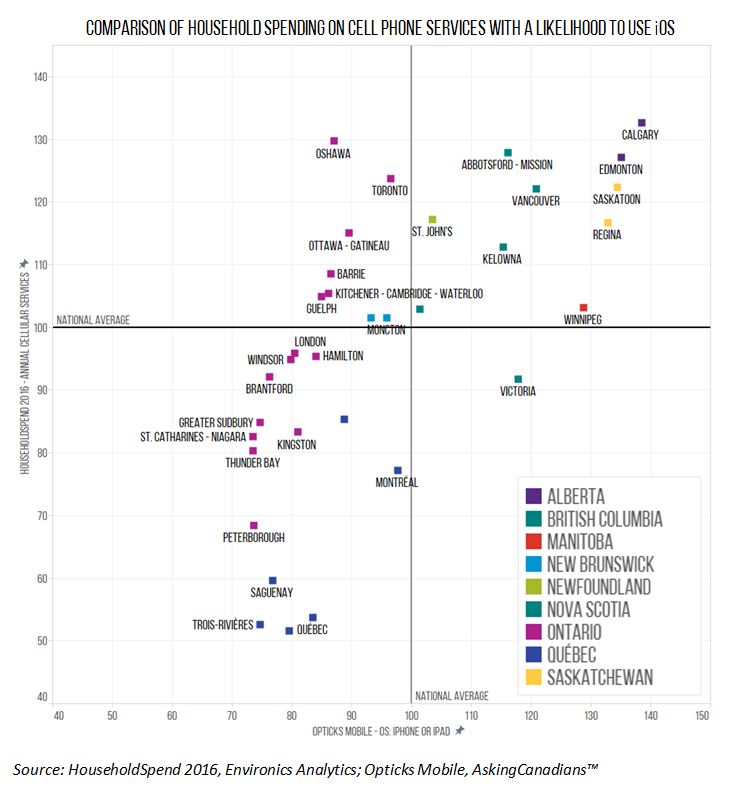
To do this at the Census Metropolitan Area (CMA) level, we can create an index value by dividing an area’s average household spending on cell phone services by the national average. This calculation provides an indicator of potential purchasing power, where an index value greater than 100 suggests a higher consumption tendency compared to the national average. Index values can also be calculated for a series of many other Opticks Mobile variables.
When comparing annual spend on cellular services based on different operating systems, we find that areas where Apple’s iOS is popular, cell phone service spending is higher. In contrast, where Android is the top operating system, households tend to spend less annually. An analysis of Canada’s larger cities reveals a couple of interesting findings related to operating systems. Of the 34 CMAs across the country, Victoria, BC, is the only one with a below-average cellular spend, but an above-average use of iOS. It is also noteworthy that in many of the CMAs in Quebec (the province with the lowest annual cellular spend), iOS is well below average. Based on this data, it appears that Apple iOS use leads to higher annual cell phone spending.


Now let’s turn to cell phone providers. While we can’t speak to the mobile plan or services that each customer is receiving, we do see a relationship between service provider and how much Canadians are spending on their cellular services. Looking at the three major players in the Canadian mobile market—Bell, Rogers and Telus—CMAs in Canada with a high proportion of Bell Mobility customers tend to spend less than others on their cell phone bills. Unfortunately, we cannot say whether this tendency is due to less expensive plans, less service or less overall usage.
Cell phone services spending linked to EA’s social value data, a view at CMA level
Now that we have insights on how regional differences and mobile characteristics affects cellular spend, let’s consider what role a consumer’s mindset plays. EA’s SocialValues data provide insights on what Canadian consumers are thinking and what motivates them, helping marketers to better reach and serve their customers. By linking a number of relevant social values—such as Enthusiasm for Technology, Financial Security and Importance of Price—to HouseholdSpend data on cellular services, we can better understand what motivates that spending.
As might be expected, among consumers who factor price into their purchase decisions (strong on Important of Price), spending on cellular services is lower. Similarly, in areas where households feel optimistic and in control of their finances (strong on Financial Security), spending on cell services is higher. What might be surprising, though, is the pattern that emerges when looking at areas that are strong on Saving on Principle (the tendency to save and accumulate money). One might expect that in areas where consumers have a strong propensity to save their money, all goods and services, including cell phone services, would be lower. But the data suggest that this is not the case. While these residents may place a high priority on stashing away their cash, when it comes to cell phone service, they become spenders rather than savers.
Something else that seemed counter-intuitive was when we linked cell service spending with the value of Technology Anxiety (the tendency to feel intimidated or threatened by advances in technology). You might expect to see areas with a high prevalence of early adopters (low on Technology Anxiety) to also exhibit higher spending on mobile services. In fact, we saw the opposite. In areas where residents feel less comfortable with technology, households tend to spend more on their cell phone services. Perhaps this is an instance where consumers are inclined to throw money at the problem, hoping that by paying more they will experience less tech-angst.
Using EA’s HouseholdSpend, marketers get a clear picture of how different neighbourhoods spend their hard-earned money. Combine that database with EA’s Opticks Mobile (powered by AskingCanadiansTM) and SocialValues surveys, and marketers can uncover revealing—and valuable—patterns on how spending tendencies relate to product offerings and consumer attitudes.
Amanda Manning is a Client Advocate in EA’s financial, insurance, telecommunications and travel practice.
Stanley Su is a Senior Research Associate/Economist in EA’s custom research department.


