


Data Analytics for the Public Sector
At all three levels, public sector organizations are facing truly unprecedented challenges as they work to manage recovery and re-opening. The questions on the minds of many government organizations are how to act on these challenges to ensure the well-being of citizens and what does communications look like? I want to share some of the ways I think about these questions and offer a different way to think about your data.
When thinking about data to understand the diversity of citizens, keep in mind:
- There is no need to re-invent the wheel. Many data points exist to help answer questions about diversity.
- Leverage multiple sources of data that can be easily linked together.
- Focus your primary research on high-value questions.
- More data points are coming. Build your analytics capacity now to incorporate them into your data holdings.
If You Can't Measure It, You Can't Manage It
For governments to respond effectively to the changes and challenges presented by the pandemic, we need a clear view of the people who are affected. We know that Canada is an incredibly diverse country and that a clear picture of Canadians requires consideration for the many forms of diversity and with that diversity, understanding the divergence of world views and perspectives.
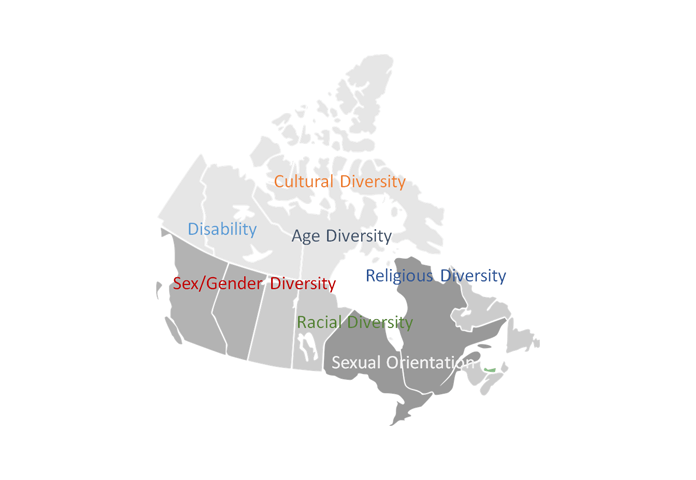
Innovations in information technology, data science and analytics have allowed us to look at diversity dimensions that were once difficult to analyze deeply. We can now look at the diversity within diversity and better understand dimensions like age, religion, disability, sexual orientation, cultural identity and gender identity. And what we see is that one size does not fit all when it comes to communicating with these communities.
The reality is, in order to manage something effectively, you have to be able to measure it. In other words, without understanding the nuances and impacts of the diverse and intersectional attributes of different Canadians, public sector organizations will have a harder time developing programs, policies and services that accurately reflect the needs of those Canadians.
The Right Data Mix = The Right Communication Strategy
The Canadian government is the single largest holder of data in the country. Having data matters, but making it useful by having the right mix of data points is essential. It is not just about what data you have, it is about how you can make it work together to get at real, usable insights. What this means to communication is that data analytics are key to creating a fulsome picture of your audience and drawing out insights that may otherwise be missed. To get to these insights, here are some important questions to ask of your data:
- How current do data sources need to be to answer your questions?
- How varied do your data points need to be to answer your questions?
- How robust a dataset is required?
- What is the right volume of data that you can use to help make your decision?
Environics Analytics pools data from over 80 different sources and repackages those data at the postal code level to create datasets that span demographics, psychographics, behaviours, lifestyles and attitudes. This approach makes for excellent building blocks to develop communication strategies from the ground up and ensure that your messaging resonates with the incredible diversity of your citizens and constituents.
Most marketers face the challenge of cutting through the noise to get a message in front of the right people and at the right time. When communicating with the public, the added layers of misinformation and "fake news" create additional barriers, particularly on matters related to navigating the pandemic, like business closures and vaccination roll-out.
Access to good data simplifies the process of developing communication strategies, making it faster, less risky and more likely to connect with your intended audience. Using geography as the hook to link data from multiple sources is a proven way to understand Canadians better. Environics Analytics has approximately 30,000 data points spanning Canadian life. For every 6-digit postal code in the country, that's 30,000 potential questions to be answered.
If you have questions, please get in touch.
Related Content
Watch: Leveraging Data to Inform Diversity, Equity and Inclusion in Business Intelligence
Watch: Making Sense of the Census
Environics Analytics Captures a Variety of COVID-19 Related Data
About Nader Shureih
With over 20 years of experience as a marketer, market research professional and academic, Nader helps local, provincial and federal departments and agencies better understand, serve and communicate with their constituents.