Ontario Election 2022: Where Do Ontarians Stand on Transportation Issues?
Transportation is turning out to be a multi-faceted issue in the 2022 Ontario election.
Several initiatives have been proposed by the various political parties, and one was even implemented by Ontario’s governing Progressive Conservatives (PCs) in the weeks before the election officially began.
Using Environics Analytics’ detailed population data, including the voter segments it developed for Ontario, we’ve analyzed who benefits most from these transportation initiatives and which ridings they live in to understand how they might affect the outcome of this election.
Vehicle registration fee rollback
Prior to the election, the governing PCs cancelled the annual vehicle registration fees charged by the province retroactively to March 2020.
The retroactive nature of the rebate meant many Ontario households received a cheque in the mail for fees they already remitted. This initiative especially benefits Ontarians with higher rates of vehicle ownership because they would receive a larger refund cheque or savings on fees payable in the future.
Who are those Ontarians and how did they vote in the 2018 election? See the table below for the numbers.
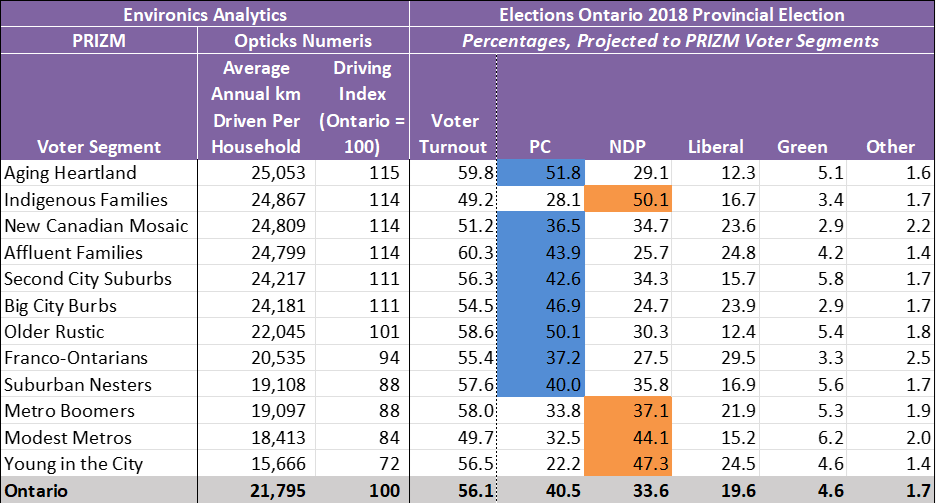
Five segments have vehicle ownership rates well above the provincial average of 1.7 per household. The Average Vehicles Per Household figure takes the number of vehicles registered in each voter segment and divides by the number of households. The Vehicles Per Household Index helps put this in perspective by telling us the percentage over or under that rate compared to the provincial average. For example, a segment with an index of 120 has 20% more vehicles per household than average.
It’s clear that this rebate benefits PC voters the most: the segments that have the highest vehicle ownership also voted decisively PC. They represent suburban families (Big City Burbs and Second City Burbs), older rural couples (Aging Heartland and Older Rustic) and affluent city families (Affluent Families). Segments with the lowest vehicle ownership tended to favour the NDP in 2018.
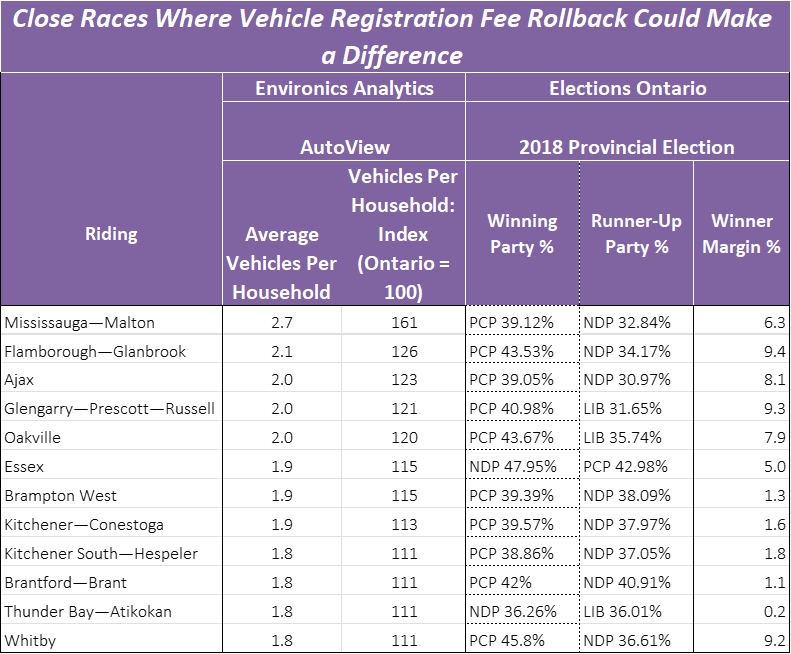
Turning to ridings, the 2018 races that were close (won by <10%) and had high vehicle ownership, we found 12 ridings where the refund could help re-elect PC MPPs that won on thin margins or could help overturn an incumbent from another party that captured a narrow victory in the last election. See the table below for that list of ridings. All were won by the PCs in 2018, except for two by the NDP, and most are in the GTA and Southwestern Ontario.
Proposed gas tax rollback
The PCs have proposed a temporary rollback on gasoline taxes. Of course, those who buy more gas will benefit the most from this initiative.
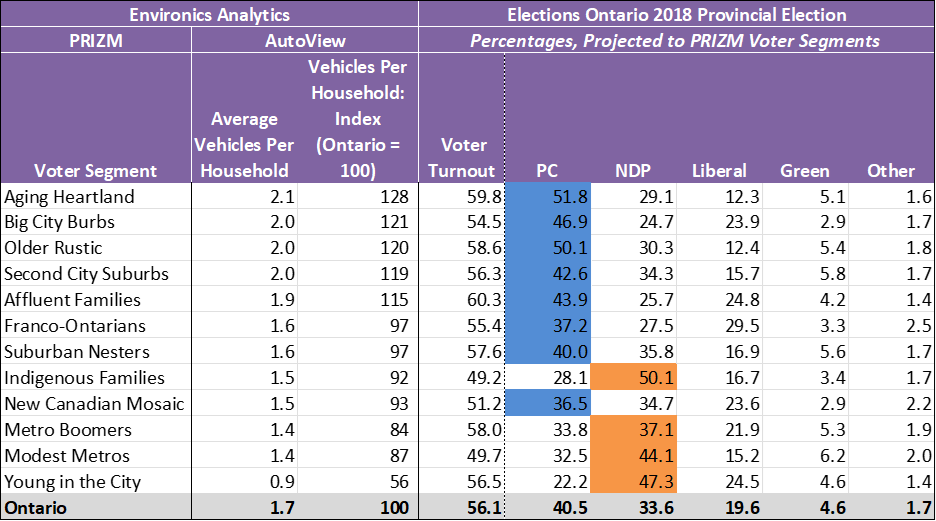
From the table below, it’s clear the segments that vote PC by wide margins will benefit the most from this tax cut because those segments also tend to drive the greatest distances.
The exception is the crucial New Canadian Mosaic segment. This is the largest voter segment and the PCs took the largest share of votes in 2018, but only by a hair: they got 36.5%, while the NDP received 34.7%. This policy might be a motivator to retain these crucial votes and turn into some riding wins where the races are tight.
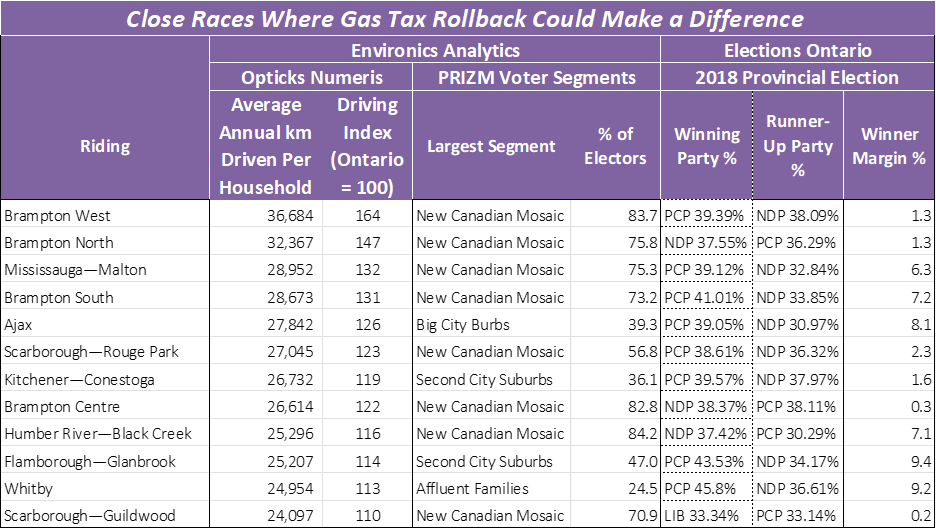
When we look at the close riding races (won by <10%) from 2018 where residents typically drive a lot, the picture is intriguing.
The New Canadian Mosaic segment mentioned earlier is dominant in eight of these twelve crucial races, with most of them in the GTA suburbs to the west (Brampton, Mississauga) and east (Scarborough, Ajax, Whitby).