


Case Study: PENN. Penningtons
Scoring markets on penetration, not average demographics, shows PENN. where new stores will work, where existing stores can grow and where real estate risk is best avoided.

Challenge
PENN., formerly Penningtons, is Canada’s destination for plus-size fashion in sizes 14 to 32. Its extended-aisle customer is not the average retail shopper.
Solution
-

EA connected 5,001,005 PENN. transaction records (Dec 2021 to Dec 2023) to PRIZM® and clustered segments into seven target groups. The three primary groups represent 67% of PENN. sales and 47% of Canadian womenswear spend.
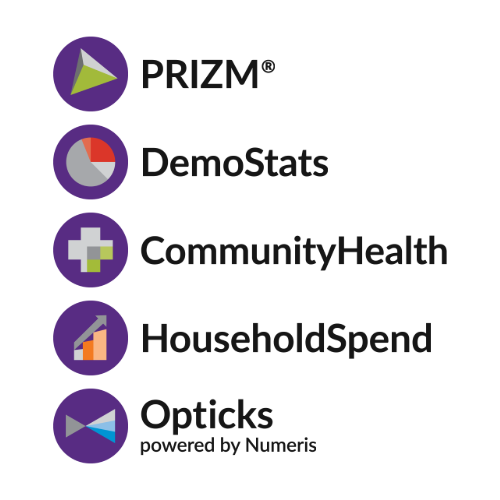
DemoStats, CommunityHealth, HouseholdSpend and Opticks added BMI class, women’s clothing spend, disposable income and life stage, because the BMI profile of PENN.’s customers, not just age or income, is the biggest factor in store location.
The customer: Who is she?
- Middle-income households
- Empty-nest to young families
- Blue- to white-collar, by market
- Mid-size and suburban markets
- Predominantly English-speaking
- Reached via TV, radio, magazines and daily newspapers
“Not the biggest spender on womenswear overall, but she over-indexes for spending with PENN.” Practicality, price and brand authenticity drive her purchase decisions.
-
Built with EA data:
-

One real driver, two kinds of opportunity.
- The real driver: BMI points to growth - Higher-BMI groups gain the most revenue from a 1% lift in penetration.
- Real estate potential: New store opportunity markets - Above-average target-group and customer penetration.
- Marketing potential: Existing store growth - Above-average target-group penetration, below-average customer penetration.

Results
Confidence to act on real estate and marketing decisions.
- Hidden opportunity: Beyond the average - BMI and health indicators surfaced what traditional demographics missed.
- Actionable: Segments that map - Target groups map to real marketing and assortment decisions.
- Two lenses: Different plays - Real estate and marketing opportunity call for different signals.
- What's next: Refresh and malls - PENN. returned to EA to refresh its segmentation and prioritize malls.