


Toronto Residents are Travelling to Neighbouring Cities for Shopping and Recreation as Regional Restrictions Change
Recent analysis shows a significant shift in Torontonians’ movement behaviours as restrictions ease in surrounding cities.
Toronto, March 10, 2021 – Environics Analytics (EA) helped the City of Toronto use data and analytics to examine its citizens’ movement patterns to inform its official position on moving to the next stage of the COVID-19 response framework. This analysis leveraged EA’s anonymized and privacy-compliant MobileScapes database that captures total visits to any given location in Canada for a specific date and time using permission-based mobile movement data. By combining MobileScapes with PRIZM®—Canada’s leading segmentation system that groups Canadians into 67 unique lifestyle types—these findings were enhanced with insights into the demographics, behaviours and preferences of Torontonians based on their postal code.
In December 2020, EA provided data to the Toronto Star to assess how frequently Toronto residents were visiting suburban shopping malls during the holiday season in neighbouring public health regions where restrictions were less stringent. Over the past month, EA analyzed mobile movement data to understand how loosening restrictions in surrounding regions have continued to draw in Toronto residents—for shopping and recreational activities—to assist the City of Toronto’s ongoing policy recommendations to the provincial government for managing the COVID-19 pandemic.
"I want to thank Environics Analytics for providing this analysis as we discussed with public health officials moving into the Grey Zone," said Toronto Mayor John Tory. "The data was helpful in showing what we were hearing anecdotally about region hopping as provincial restrictions began to change in different areas outside our city. It demonstrates the challenge posed by health measures differing from region to region. While our focus remains first and foremost on protecting people and following the public health advice, this data was one of many other considerations factored into my support for moving into Grey and allowing more businesses to begin to open their doors."
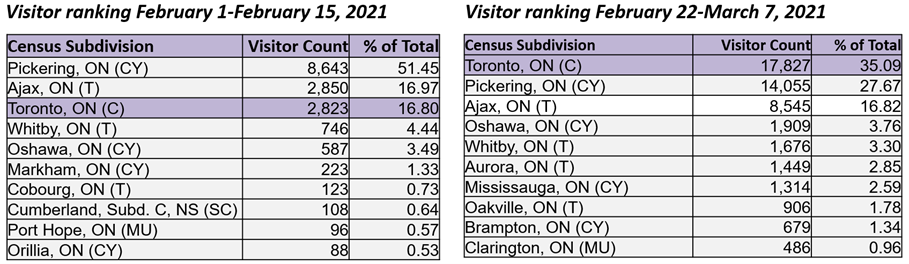
An analysis was conducted of Torontonians’ visitation to three malls—Pickering Town Centre, Vaughan Mills and Toronto Premium Outlets in Halton Region—and two ski hills—Blue Mountain and Mount St. Louis Moonstone—comparing February 1 to 15 with February 22 to March 7, 2021. The second two-week period saw Durham, York and Halton regions move to the Red – Control level of provincial COVID-19 framework which included the re-opening of some indoor shopping and other activities, compared to Toronto and Peel’s Grey – Lockdown status.
During the February 22 to March 7, 2021 period, Toronto residents visiting these locations jumped dramatically, becoming the number one source of visits in all but one of the five locations. The exception was Toronto Premium Outlets, which is relatively far from Toronto. This location had visitors from Brampton and Mississauga, both also operating under Peel Region’s Grey – Lockdown restrictions.
The table below shows how the number of visitors from Toronto to Pickering Town Centre has changed during the February 22-March 7 period compared to the February 1-February 15 period.
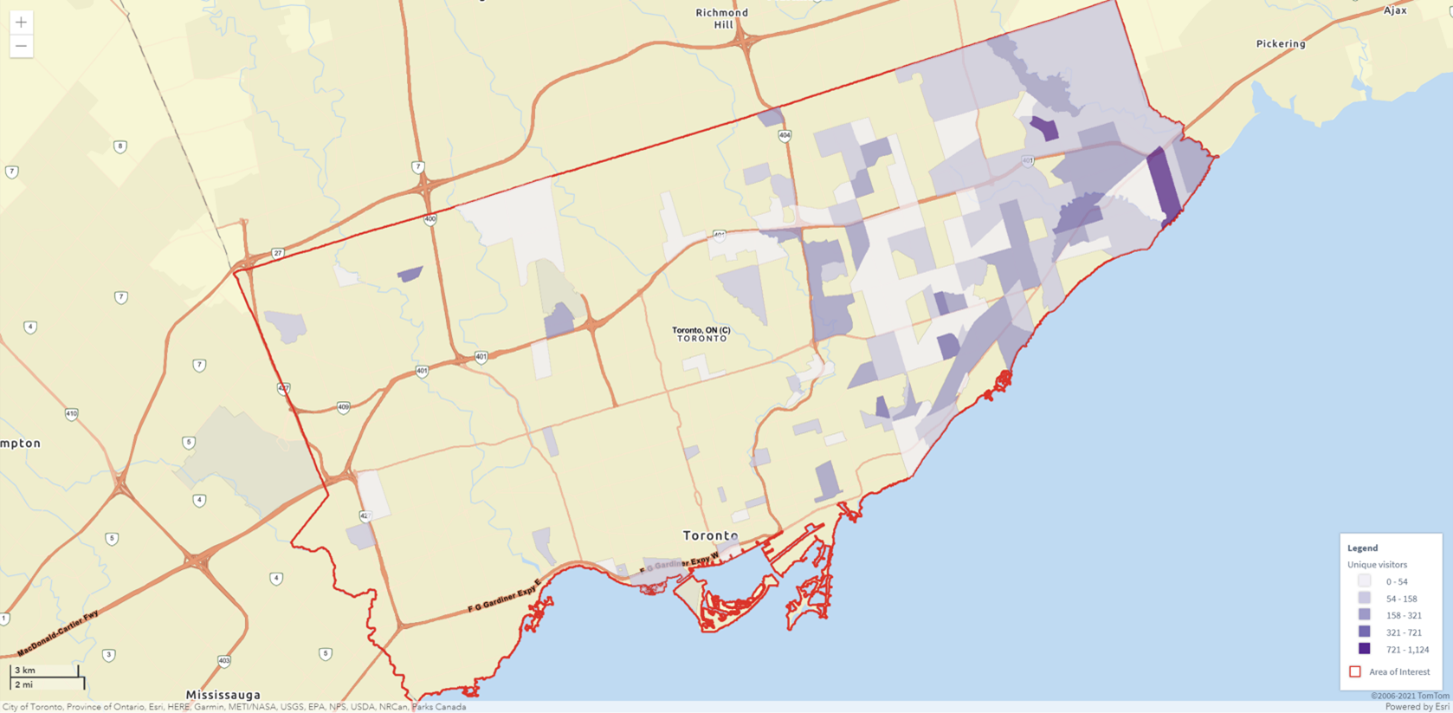
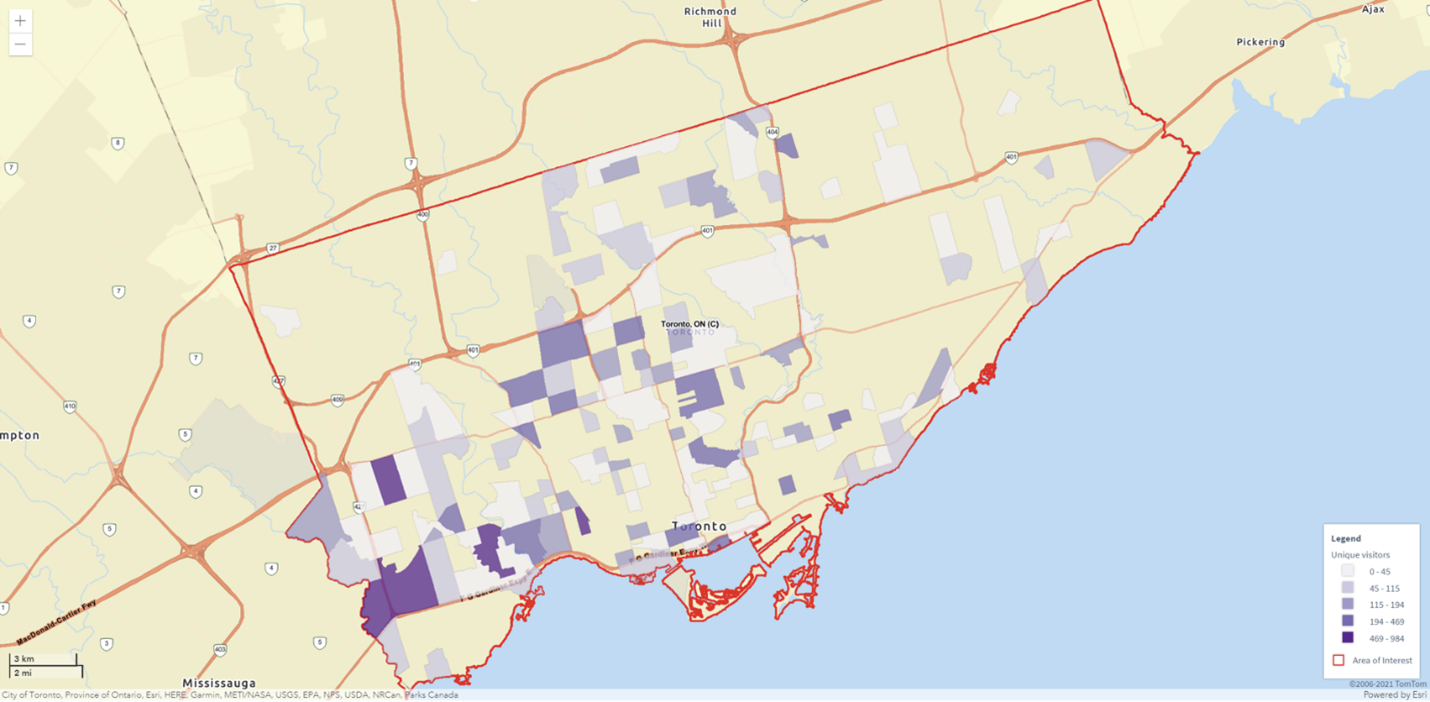
The map below shows the distribution of visitors to Pickering Town Centre by census tract over the period of February 22-March 7, 2021.
Mall Visitors
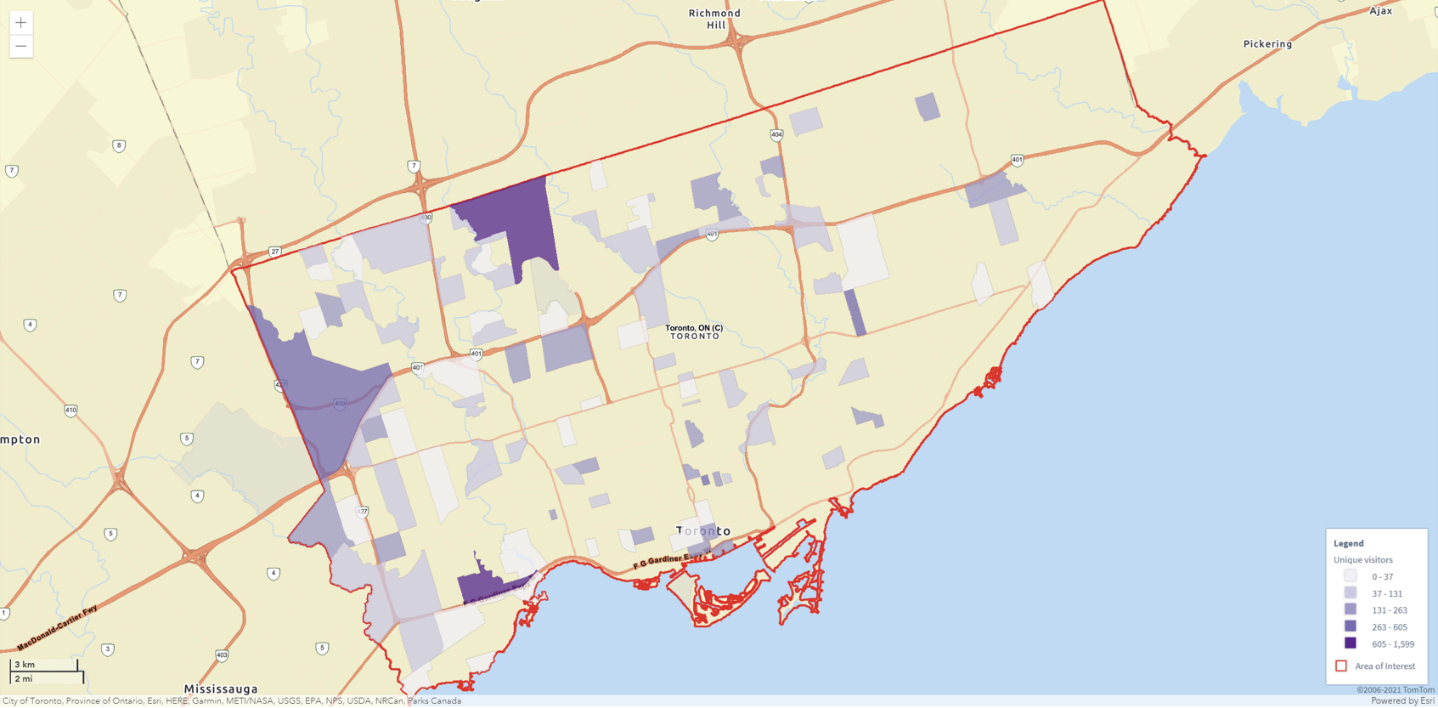
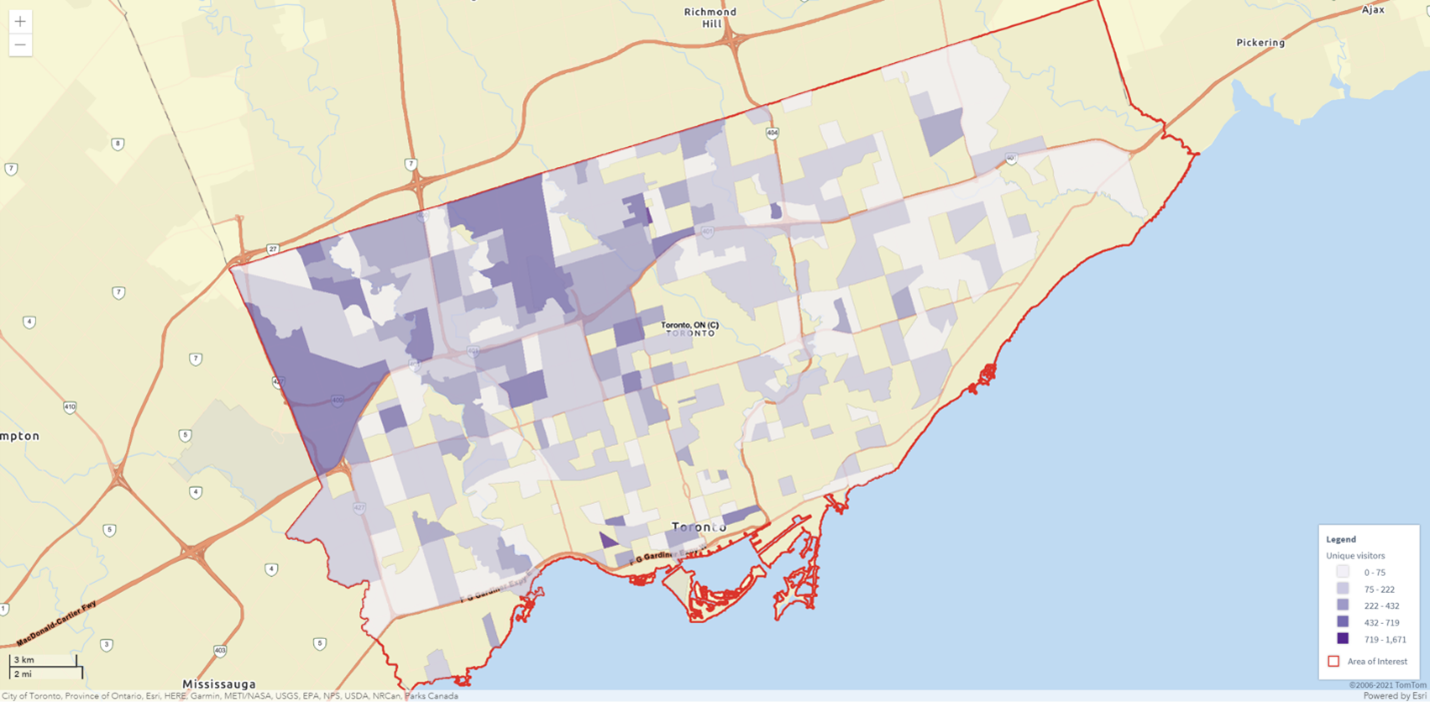
The data revealed that proximity mattered significantly in reviewing the visitors to malls. Pickering Town Centre drew residents from the eastern parts of Toronto, while Vaughan Mills and Toronto Premium Outlets gained more visitors from the western and northern parts of the city. However, visitors to Toronto Premium Outlets were concentrated among people living near major expressways.
The map below shows the distribution of visitors to Toronto Premium Outlets by census tract over the period of February 22-March 7, 2021.
The map below shows the distribution of visitors to Vaughan Mills by census tract over the period of February 22-March 7, 2021.
The data revealed a consistency among the types of Toronto residents making the trips to these three outlying malls. According to the PRIZM® lifestyle segmentation, these residents represent middle to lower-income suburbanites who typically live in apartments with a household makeup that tends to be culturally diverse. Additionally, among the segments that ranked highest for travelling to Vaughan Mills and Toronto Premium Outlets, the data showed a concentration of condo-living young singles.
The exhibit below shows the three lifestyle types that ranked highest for visiting Vaughan Mills and Toronto Premium Outlets over the period of February 22-March 7, 2021.


Ski Hill Visitors
When analyzing visitors to Blue Mountain and Mount St. Louis Moonstone, the data revealed proximity to be less important, as skiers flocked from locations spread around the city. By looking at those visitors through PRIZM, the data showed they were more affluent on average than those who attended malls over the same period of February 22 – March 7, 2021. The segments that stood out consisted of culturally diverse, suburban middle-class families and a cohort of wealthier empty-nesters and families. The next exhibit shows the top three segments— “Metro Melting Pot”, “Eat, Play, Love” and “Downtown Verve”—representing common visitors to Blue Mountain during the first week of open ski hills.

The map below shows the distribution of visitors to Blue Mountain by census tract over the period of February 22-March 7, 2021.
At a glance, these data quickly illustrate the types of citizens that the city or any other organization may want to understand and communicate with. Thousands of additional variables are available at the postal code level for analysis that can provide rich insights about any target group.
PRIZM is a registered trademark of Claritas, LLC.
About Environics Analytics
Environics Analytics (EA) is the premier marketing and analytical services company in North America,
helping thousands of customers across every industry sector turn data and analytics into strategy, insights and results. Established in 2003, we specialize in using best-in-class data, analytics expertise and purpose-built software to address key
challenges in areas such as consumer profiling and segmentation, multichannel media planning and execution, trade area analysis, merchandising strategies and site location decision-making. Our ENVISION platform provides quick and easy access to our
comprehensive and privacy-compliant databases—including the latest mobile movement data—to generate deep consumer and market insight, authoritative reports and detailed maps. Environics Analytics' team of 200 statisticians, modellers,
geographers and business strategists help organizations develop data-driven solutions and achieve success along every phase of their analytics journey.
Learn more at www.environicsanalytics.com