The Many Faces of Vulnerability in the Time of COVID-19 [Study]
The COVID-19 pandemic has made large segments of the population vulnerable to different types of hardship and uncertainty beyond the immediate health impacts of exposure to the coronavirus. These impacts affect every sector of the economy, so it is important for government, NGOs and businesses alike to understand who needs support, what kinds of services are required for different populations, and the direction business will take as the economy reopens.
Vulnerability takes on different forms; understanding how vulnerability actually plays out will result in more effective programs or business strategies directed efficiently to the right populations.
Environics Analytics used its vast array of population data to understand who is vulnerable, what these populations are like, and where they can be found. We did this by looking at three types of vulnerability and expressed them as three “indexes” which are weighted composite scores of a series of variables (details are provided in each section by index):
- Financial Vulnerability Index – those likely to have difficulty keeping up with financial obligations in response to a sudden drop in income
- Social Vulnerability Index – those likely to experience a greater burden from social isolation due to mental health and limited social networks and supports
- Frailty Index – the elderly and those in poor health, with particular emphasis on the comorbidities of concern for COVID-19
Financial Vulnerability Index (FVI)
Beyond health, the financial impact of this crisis is on the minds of many in government, social services and private industry alike. Which Canadians are most likely to be able to pay for housing, other necessities and service debt after a sudden loss of income depends on a range of household financial indicators. The Financial Vulnerability Index takes these into account to score how precarious the typical household’s finances are at the neighbourhood level:
- Availability of savings and liquid assets
- Levels of different types of debt
- A measure of discretionary income
- Debt to discretionary income ratio
We looked at the FVI through the lens of Environics Analytics’ PRIZM lifestyle segmentation system and how the many “faces” of financial vulnerability play out at a community and neighbourhood level. Understanding the kinds of populations most likely to be in trouble at a local level allows financial service providers, utilities and governments to respond with better-designed initiatives tailored to these populations’ needs. For example, proactive payment plans, payment due dates, loans, subsidies or grants can be provided so those who need help get it in a form that is supportive. Retailers can also rethink product support based on their local communities’ financial position. The benefits are many-fold: governments can provide support in a targeted way, reducing waste and subsidies to those who do not need them; utilities and telcos can proactively identify those most likely to fall into collections; financial services and retailers can ensure they are providing supports and products that take into account a changing affordability landscape. Everyone, both public and private, benefits from positive public sentiment from the provision of relevant support in a difficult time.
Sixteen of the 68 PRIZM segments had a FVI of 115 or above (Canadian average is 100). We grouped similar segments together to give a high-level picture of financially vulnerable groups. The main drivers of high vulnerability for each group, some sample PRIZM segments within each group, and examples of communities where the groups are found in large numbers are shown below in the table below.
PRIZM Segment Analysis of Financially Vulnerable Groups in Canada amidst COVID-19

Social Vulnerability Index (SVI)
Some Canadians are more likely to be challenged with COVID-19 physical distancing and isolation measures due to mental health and limited social networks. Governments and social service agencies are well aware that some Canadians will inevitably have difficulty coping. The Social Vulnerability Index in combination with PRIZM helps shed light on who is most likely to have difficulties. This allows program support and communications to be designed with specific target populations in mind and focussed on the neighbourhoods most at risk. The SVI is constructed with the following variables, and every six-digit postal code in Canada has an associated SVI:
- Single-person households
- Self-reported rates of poor or fair mental health
- Rates of orientation towards “Community Involvement” (a psychographic variable)
- Confidence in being able to rely on others in the community
- Measures of having close friends and family
- Unemployment rate (pre-COVID estimates)
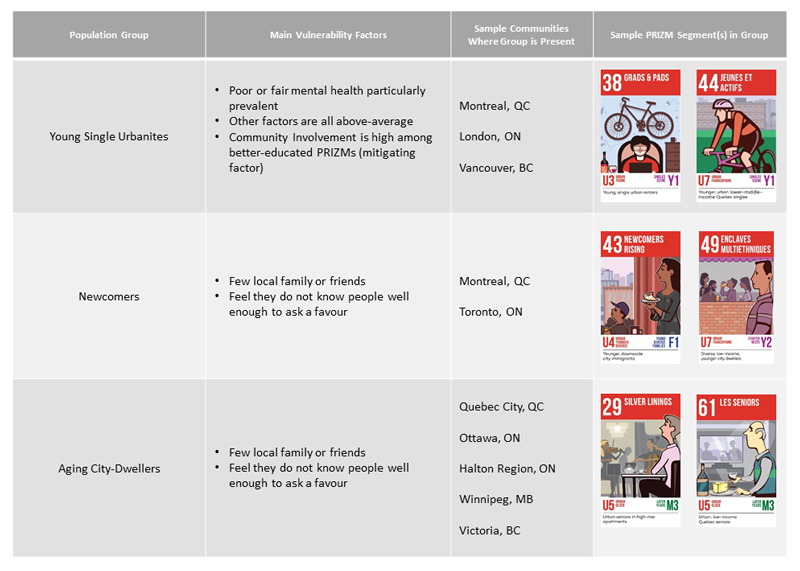
Eighteen of our 68 PRIZM lifestyle segments had a Social Vulnerability Index of 115 or more. We put similar segments together to give a high-level picture of socially vulnerable groups and the main driver of that vulnerability below. Overall, social vulnerability tends to be more of an urban phenomenon and is more concentrated among those with lower incomes. But there are middle-income segments and pockets of vulnerability in suburbia and rural Canada where older residents are likely to be struggling. Generally, Young Single Urbanites tend to score above-average on all factors that contribute to the index. Newcomers and Aging City-Dwellers especially tend to lack community networks but score better on the mental health indicator than the younger group.
PRIZM Segment Analysis of Socially Vulnerable Groups in Canada amidst COVID-19

Frailty Index (FI)
The Frailty Index identifies Canadians more likely to have difficulty going about day-to-day activities in their communities due to their age, physical limitations, or health (especially conditions that are comorbidities of concern for COVID-19). Governments, health providers, retailers, restaurants, financial services and others can support these residents in running day-to-day errands, having home delivery services available (even as business closures ease) and providing help in understanding what precautions to take to protect themselves from infection. Every six-digit postal code in Canada has a Frailty Index. We included the following measures in this index:
- Population 65 years and older
- Self-reported health as poor or fair
- Self-reported presence of physical limitations
- Physically inactive
- Household income
- Prevalence of Chronic Obstructive Pulmonary Disease (COPD), heart disease, cancer, asthma and diabetes
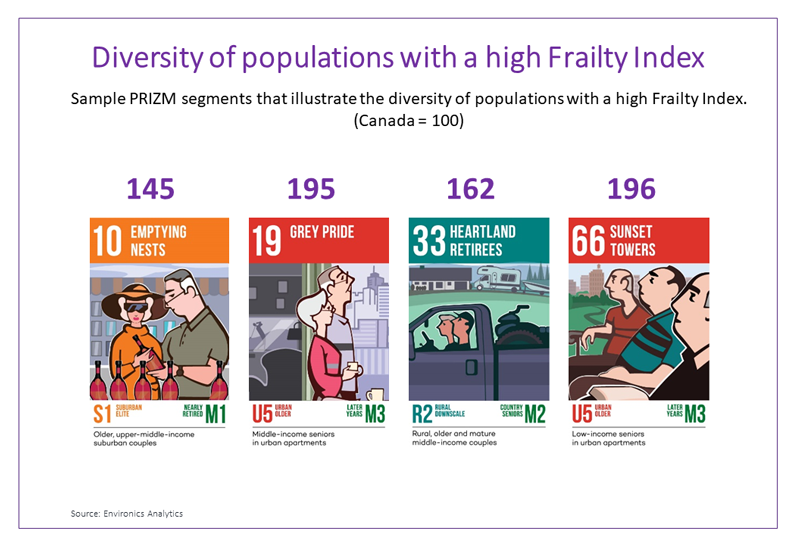
Frailty is largely a picture of senior populations across Canada, with those having higher disease prevalence scoring more strongly on the FI. Understanding the population that an organization is trying to serve is critical in designing services and communication that will resonate. Below are a few sample PRIZM segments that illustrate the diversity of populations with a high Frailty Index (Canada = 100). Twenty-three of 68 PRIZM segments score 115 or higher on the Frailty Index, and they span the socio-economic spectrum from 10 Emptying Nests (near the top) to 66 Sunset Towers.

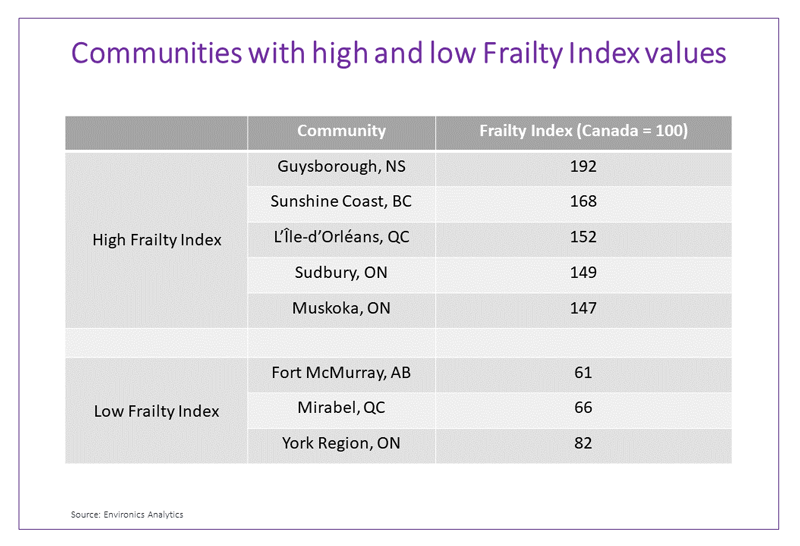
How frailty plays out at a community level is also important to prioritize the response by senior levels of government or for businesses assessing market-level needs. Communities with high and low Frailty Index values are shown below to illustrate. Note that communities with low FI still have pockets of need within their communities. Use of good small-area data are even more important in these communities to cost-efficiently address those needs where they exist.

Read about the findings of this study in The Toronto Star
Watch SVP and Practice Leader Rupen Seoni talk about the study on CTV News
_________________
All charts are generated by Environics Analytics. To learn more about the data used in the creation of this study or to ask a question about your specific situation, get in touch. We’re ready to help.


