


How Restaurants Can Survive the New Normal
Restaurant owners and operators are in a tough position. Stringent (and justified) safety measures due to the COVID-19 pandemic reduced restaurant serving capacity across the board. When restrictions eased in the summer, many restaurants, including QSRs, found that the volume of customers simply was not where it was prior to the lockdown. Only a short time later, lockdown restrictions have been reimposed throughout parts of the Greater Toronto Area (GTA), Ottawa and other urban centres as the battle against the pandemic continues.
Restaurant owners, operators and planners now face the hard decision – to innovate in hopes that business will eventually return or to close entirely. In the scenario below, I use data from the first wave of the pandemic and our analytics platform ENVISION to demonstrate what a restaurant can do to understand their unique local market and the opportunity that is there to help answer this and other tough questions. What is clear is that now is the time to monitor ongoing market activity to anticipate a resurgence (or lack of) demand and to inform what strategy makes the most sense to adopt.
How data can help restaurant owners plan for what's next:
- Visitor data are essential to determine whether demand has dropped due to the pandemic or if market activity is picking up but customer preferences have changed and your restaurant is not keeping up.
- Mobile movement provides an objective measurement of year-over-year and month-over-month comparisons of visits by location to better understand trends and behaviour.
- Mobile movement data can be used as an overall indicator of market activity within a trade area. When used to compare against visitors or visits made to a specific location, it can help us to understand traffic recovery and anticipate traffic surges.
- Once we understand traffic patterns and market activity, the PRIZM customer segmentation system can provide details of the lifestyle types who are active in the trade areaand what may motivate their behaviour.
Answer questions like:
- Is the volume returning to my local trade areas and has my audience changed compared to my key competitors?
- How can I adapt to my new volume of traffic and streamline my operation?
- Does our volume of traffic allow us to continue offering dine-in after reduced throughput from following safety guidelines?
A sample market analysis of two GTA restaurants
Let’s look at two restaurants located within the GTA, one in Toronto (Location A) and the second in Richmond Hill (Location B). Both locations have seen an overall decline in customer traffic compared to the prior year and are naturally considering their operation's future. Using mobile movement data to look at the total unique visitors to both restaurant locations over the last 12 months (August 2019 – September 2020) compared to the prior 12 months (August 2018 to September 2019), a great deal of changing consumer behaviour becomes evident. For these purposes, “visitors” represent diners that stopped for takeout and dine-in meals.
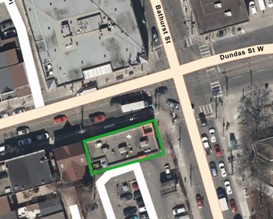
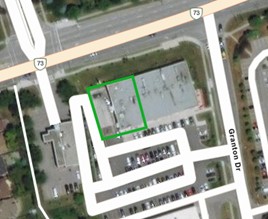
Pictured Above: Geofences around Toronto (Location A) and Richmond Hill (Location B)
Year-over-year Traffic Comparison
Toronto (Location A) and Richmond Hill (Location B)
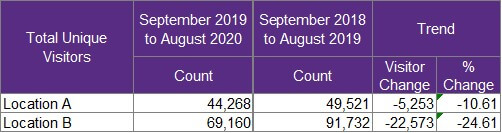
*The year-over-year comparison represented in the chart above indicates a drop in traffic across both locations but a much larger decline in the Richmond Hill (Location B) restaurant.
Month-over-month Traffic Comparison
Toronto (Location A) and Richmond Hill (Location B)
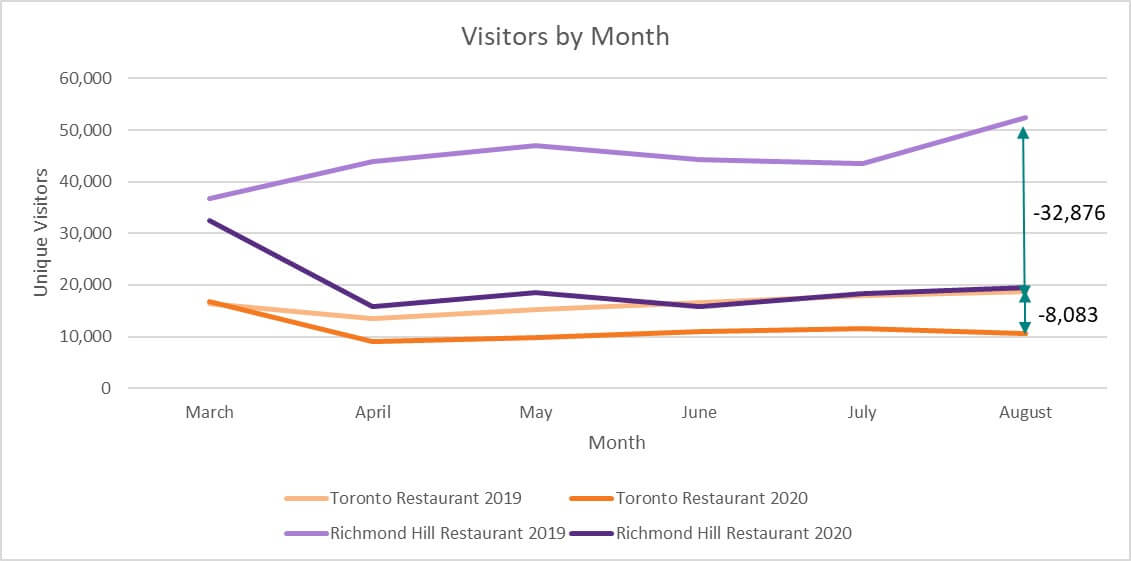
Will my volume of customers ever return to what it was?
A closer look at the month-over-month comparison suggests that the Richmond Hill restaurant (Location B) experienced a sharper decline in visitor traffic, losing roughly 25% of visitors despite reopening to the public. The number of unique visitors has remained much lower than the prior-year and traffic between July and August remained flat in 2020, where it had picked up sharply the previous period. This suggests that the Richmond Hill restaurant will have to take more drastic steps to reduce its operating expenses or consider cutting dine-in options.
The decline in visitors at the Toronto restaurant (Location A) is much smaller than the decline experienced by the Richmond Hill “Location B”, with only a 10% reduction from last year. After the initial drop in visitors when the lockdown was implemented, we see that the slope is similar in 2019 and 2020. Seasonal variation remains consistent within the same period last year, suggesting that this location can keep an optimistic outlook. Aside from adjusting overall operations for this drop in traffic, they have a better opportunity to remain profitable.
Did market demand drop or have customer preferences changed?
Trade Area Analysis
Toronto (Location A) and Richmond Hill (Location B)


*Trade area definitions use the most recent 12 months of data and are defined by where the closest 70% of visitors can be found using MobileScapes mobile movement data.
A closer look at the month-over-month comparison suggests that the Richmond Hill restaurant (Location B) experienced a sharper decline in visitor traffic, losing roughly 25% of visitors despite reopening to the public. The number of unique visitors has remained much lower than the prior-year and traffic between July and August remained flat in 2020, where it had picked up sharply the previous period. This suggests that the Richmond Hill restaurant will have to take more drastic steps to reduce its operating expense or consider cutting dine-in options.
The decline in visitors at the Toronto restaurant (Location A) is much smaller than the decline experienced by the Richmond Hill “Location B” restaurant, with only a 10% reduction from last year. After the initial drop in visitors when the lockdown was implemented, we see that the slope is similar in 2019 and 2020. Seasonal variation remains consistent within the same period last year, suggesting that this location can keep an optimistic outlook. Aside from adjusting overall operations for this drop in traffic, they have a better opportunity to remain profitable.
Out & About Activity by Month
Toronto (Location A) and Richmond Hill (Location B)

*Out-and-about activity around Location A and Location B restaurant sites using the most recent 12 months of data and defined by where the closest 70% of visitors to these locations are captured.
Measuring the count of households that are travelling at least .5km from their home can be undertaken using out-and-about analysis from aggregated mobile data. We see that the local markets around both restaurant locations appear to be on a similar recovery trajectory. While the number of people leaving their homes within the Richmond Hill restaurant trade area increased, we do not see the number of visitors to their restaurant increasing at the same rate. It is possible that the Richmond Hill restaurant’s audience may have fundamentally changed their behaviour or that this location could have taken more meaningful steps to drive traffic back up.
How did my audience change and who are the people dining out?
PRIZM customer segmentation data can be used to help identify the core lifestyle characteristics of restaurant visitors and understand how to appeal to them to keep them coming back. If we compare August visitors in 2019 to 2020 in both restaurants, we see the following PRIZM lifestyle types:
Visitor Profiles - Toronto (Location A)
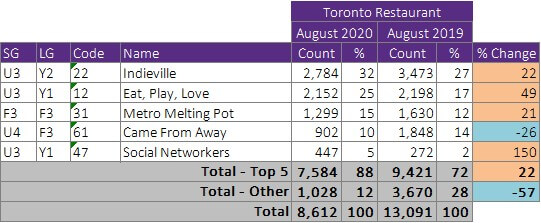
There is a substantial shift and concentration in lifestyle types for the Toronto location as suggested by the percent change. Segment 22 – Indieville, increasingly represents a larger portion of this location’s audience. Visitor volume belonging to Segment 12 – Eat, Play, Love, are practically the same year-over-year. Anecdotally, this concentration in visitor type suggests that those who are still visiting are the ‘die-hards’ who can’t live without their favourite restaurant and represent urban, young singles and couples.
Visitor Profiles - Richmond Hill (Location B)
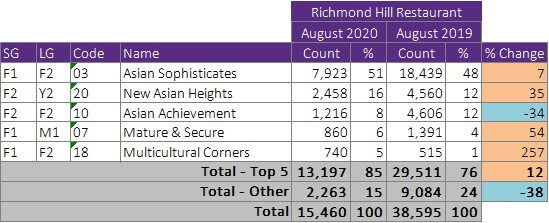
We see a similar trend at the Richmond Hill restaurant. There is an overall shift in the concentration of visitors towards the top 5 lifestyle groups who made up 85% of visitors in August 2020 but who represented 76% of visitors in August 2019. Segment 03 – Asian Sophisticates make up over half of all visitors and we also see a larger proportion of visitors from Segment 20 – New Asian Heights. Again, this would suggest that the audience still dining out at this restaurant are true fans. An interesting point is that while overall traffic decreased substantially compared to the prior year, the top lifestyle types remained the same.
In closing
We identified how the Toronto restaurant saw a smaller decline in its visitor traffic and when visitor traffic returned, it was in line with market activity. This location may not need to take as drastic of a step to remain profitable. The visitor shift towards a younger demographic presents an opportunity to engage with this audience in new ways. Offering a happy hour or driving social media buzz could help this restaurant continue to find success.
The Richmond Hill restaurant saw a more sizeable drop in traffic and that the visitor traffic did not increase proportionate to the increase in its market activity. This restaurant’s diner base predominantly consisted of established families who may be fearful of the repercussions of dining-out until a vaccine is available. Bold moves may be needed to return to pre-COVID profitability such as removing dine-in options completely and operating take-out only.