The Power of GIS: Mapping Insights That Tell a Story
On GIS Day in Canada, November 20th, we reflect on the incredible ability of Geographic Information Systems (GIS) to reshape how we understand and interact with the world. At Environics Analytics (EA), GIS isn’t just a tool - it’s a transformative way to tell stories through data, enabling organizations to uncover insights that lead to meaningful decisions and lasting impacts.
Why GIS Matters
GIS goes beyond plotting points on a map. It provides a sophisticated framework for analyzing spatial data, uncovering patterns, and making connections that aren’t immediately obvious. By integrating geography with data, GIS delivers a powerful lens through which organizations can better understand their markets and target audiences.
Whether it’s urban planners optimizing city layouts, retailers identifying and tapping into potential markets, or governments responding to natural disasters, GIS answers pivotal questions, such as:
- Where can our business open another location?
- What are the spatial patterns impacting my business or community?
- How can we allocate resources more effectively?
By answering these questions, GIS turns raw data into actionable insights grounded in real-world context.
The Role of GIS at Environics Analytics
GIS is more than a technology – it's a way of thinking. At EA, GIS is central to our mission of delivering data-driven insights that:
- Empower Decision-Makers: By turning data into actionable insights, we help organizations of all sizes make confident, informed decisions.
- Foster Understanding: GIS simplifies complexity, enabling clients to see the big picture and granular details simultaneously.
- Drive Impact: From supporting economic development to advancing sustainability, GIS enables us to make a tangible difference.
Our innovative tools and data products bring GIS to life, helping clients visualize their markets, customers, and communities in new ways. Through ENVISION, our proprietary SaaS platform, we combine GIS technology with comprehensive data sets to help clients make informed choices. At the core of ENVISION is robust mapping functionality built on Esri’s ArcGIS server, a leading platform in geospatial technology. From trade area analysis to market segmentation, GIS at EA enables our clients to see the “why” behind the “where”.
Celebrating Our GIS Day Contest Winners
GIS Day is a time to celebrate the innovation and creativity that GIS inspires. This year, we hosted our first GIS map contest, showcasing the exceptional ways our colleagues and clients use GIS to tell compelling stories through our data. Congratulations to our winners!
Winning Client: Peter Haoxuan Ge (Research & Teaching Assistant - Department of Geography, Geomatics and Environment, University of Toronto – Mississauga)

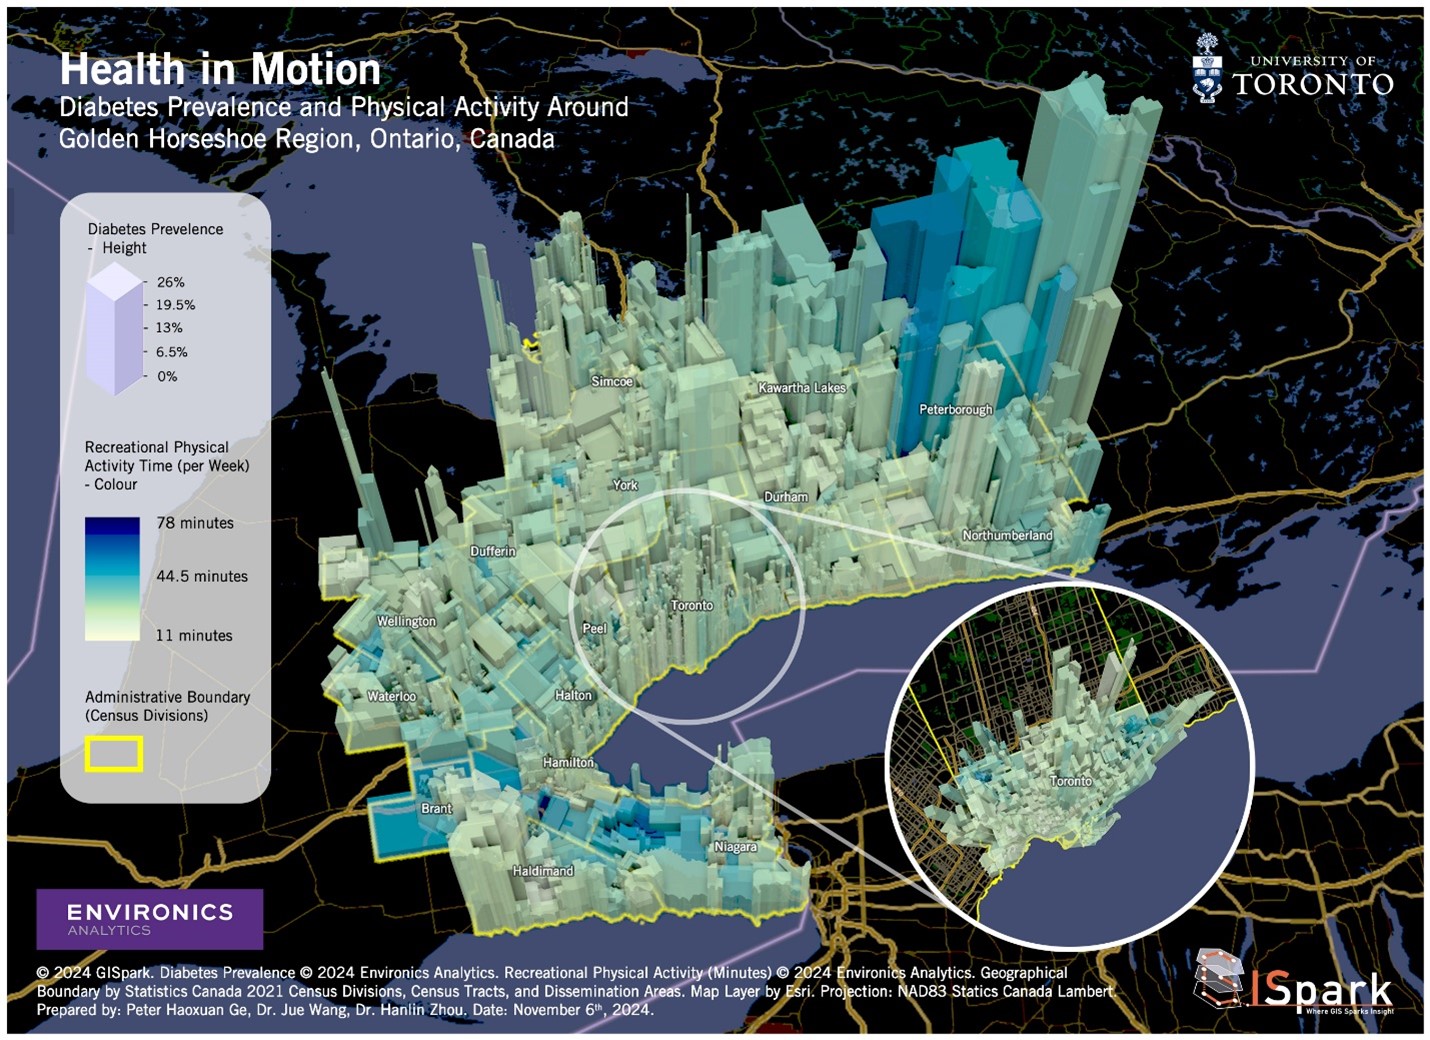
Map Description: According to the International Diabetes Federation, the rising number of diabetes cases worldwide is emerging as one of the most significant global healthcare emergencies. In Ontario, Canada, more than 1 in 7 adults have been diagnosed with diabetes, and the prevalence rate nearly doubled over the past two decades. Research has shown that regular daily physical activity can effectively prevent and reduce the risk of diabetes. Using the rich community health data from Environics Analytics, we mapped and visualized recreational physical activity time alongside diabetes prevalence rates across the Golden Horseshoe Region in Ontario. The tallest bars in the map, representing higher diabetes prevalence rates, are concentrated in the northern to eastern regions, particularly around Peterborough. The colour gradient indicates recreational physical activity time, with darker blue areas showing higher weekly activity levels. The map reveals spatial clustering of high and low diabetes prevalence rates, each with varying physical activity levels. We hope this map can guide public health authorities in designing targeted intervention programs tailored to specific geographical areas, aiming to reduce the burden of diabetes.
Winning EA Team Member: Matthew Senyshen (Data Analyst, Data Solutions)

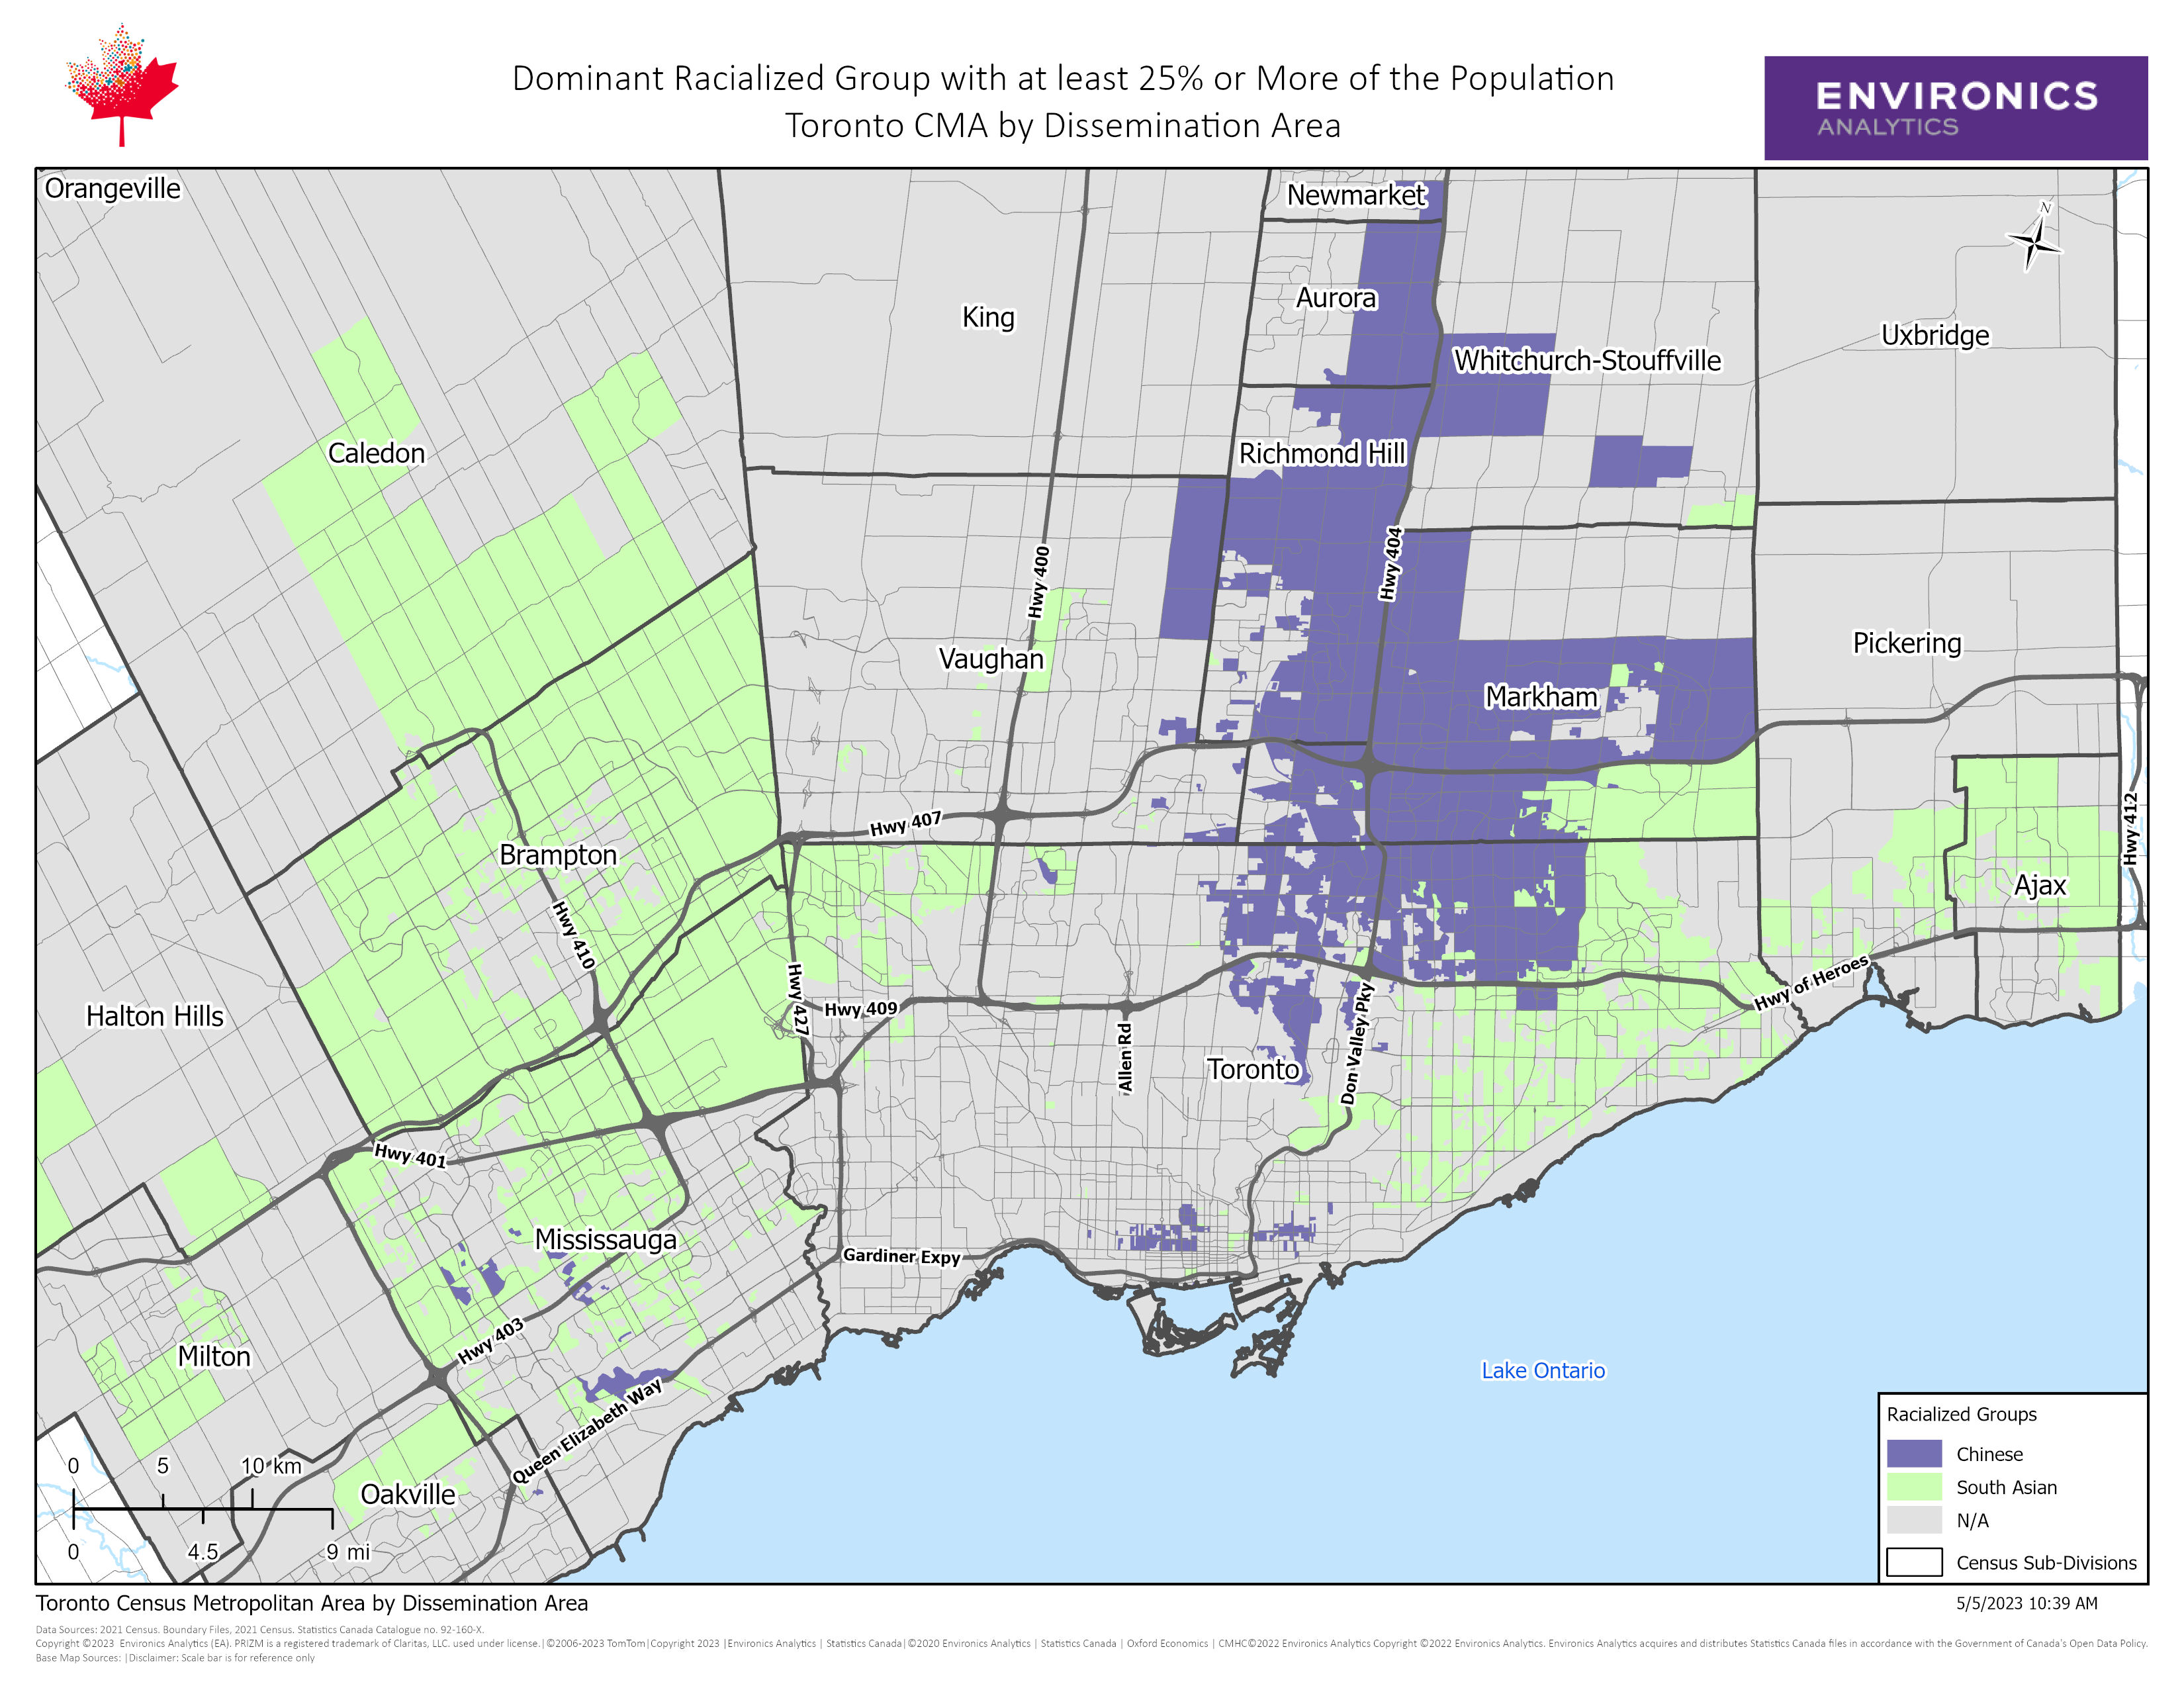
Map Description: This map is titled 'Dominant Racialized Group with at least 25% or More of the Population Toronto CMA by Dissemination Area'. This map clearly shows where significant portions of Chinese and South Asian people live within the Toronto CMA.
These winning submissions highlight the versatility and power of GIS. Each map exemplifies how spatial data can reveal new perspectives, solve real-world challenges, and inspire action. Thank you to all who participated in our first GIS Day contest!
The Future of GIS and Mapping
As GIS technology continues to evolve, so do its possibilities. Innovations like real-time data integration, machine learning, and predictive modeling are expanding the scope of spatial analysis. We are committed to staying at the forefront of these advancements to ensure our clients have access to the most cutting-edge tools and insights. As we celebrate GIS Day in Canada, we reaffirm our commitment to using GIS to illuminate, connect, and transform.
Want to learn more about how we can help your organization make data-driven decisions? Reach out today to explore how mapping can transform your data into actionable insights.
Happy GIS Day!


