



The Next-Gen Customer: Serving Four Generations at Once
The store has finite shelf space, a lean team and shoppers from four generations walking through the same doors. The challenge is no longer personalization, it is prioritization: what to assort, where and for whom, under real pressure on space, labour and margin.
Environics Analytics looked at Canada’s changing population and how the differences between Gen Z, Millennials, Gen X and Boomers shape consumer products retail. Here is what matters, and what they mean for retailers, brand owners and marketers alike.
Canada’s growth has stalled, and the map has changed
Canada’s population grew just 0.5 percent between July 2025 and June 2026, according to Statistics Canada. That is the slowest rate in 75 years. The turn was sharp. Annual growth was nearly 3 percent in 2023 to 2024.
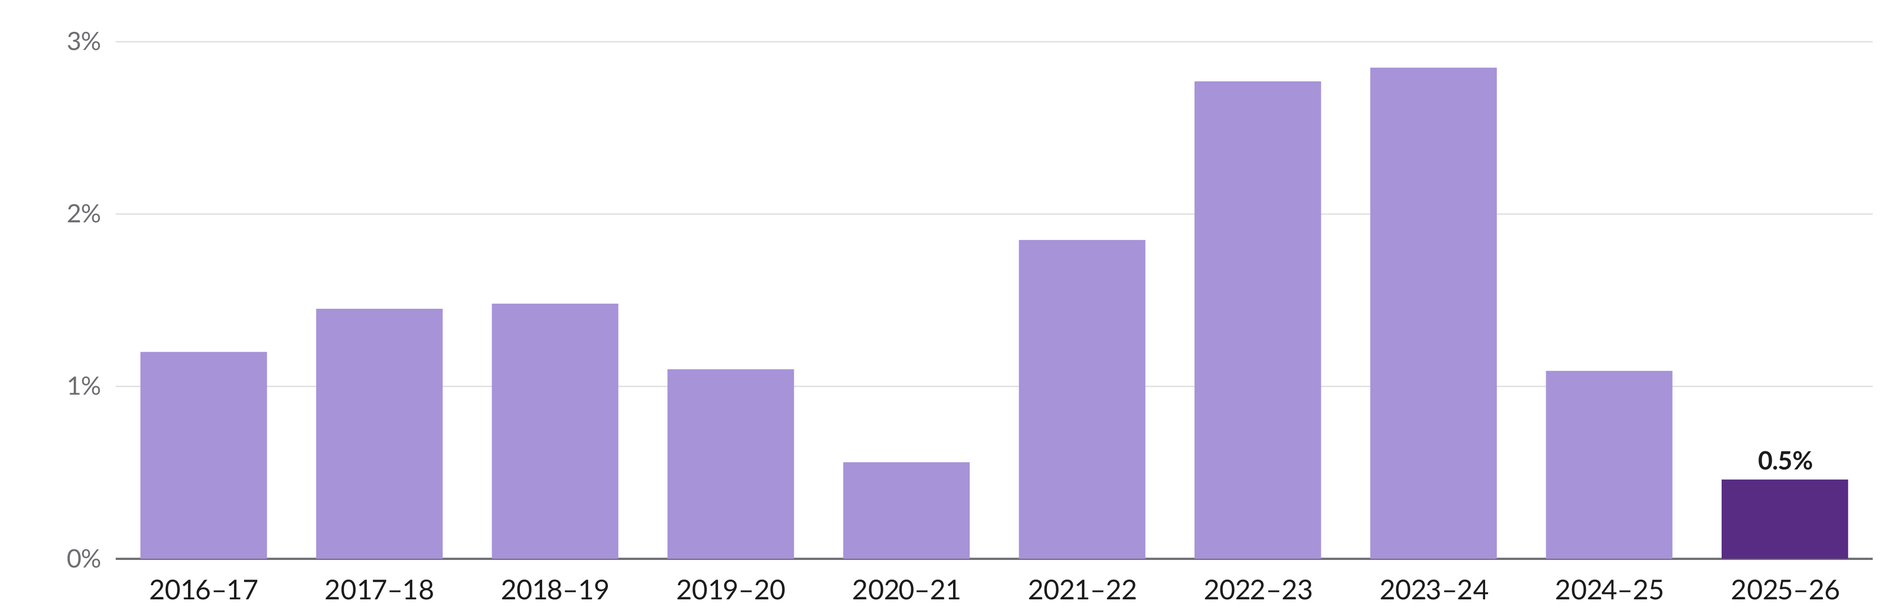
Annual population growth, Canada (percent), 2016-17 to 2025-26.
The slowdown began in late 2024, when more temporary residents started leaving Canada than arriving. With births and deaths now close to equal, immigration drives national growth, and it has been dialled back.
Growth was also uneven. Alberta grew fastest, at about 1.5 percent, while Ontario, Quebec and British Columbia grew least. Six of the 12 largest census metropolitan areas shrank, including Montréal (-0.61 percent), Toronto (-0.57 percent) and Vancouver (-0.41 percent). Calgary (1.63 percent) and Edmonton (1.23 percent) grew fastest, supporting the continued growth of the Alberta market.
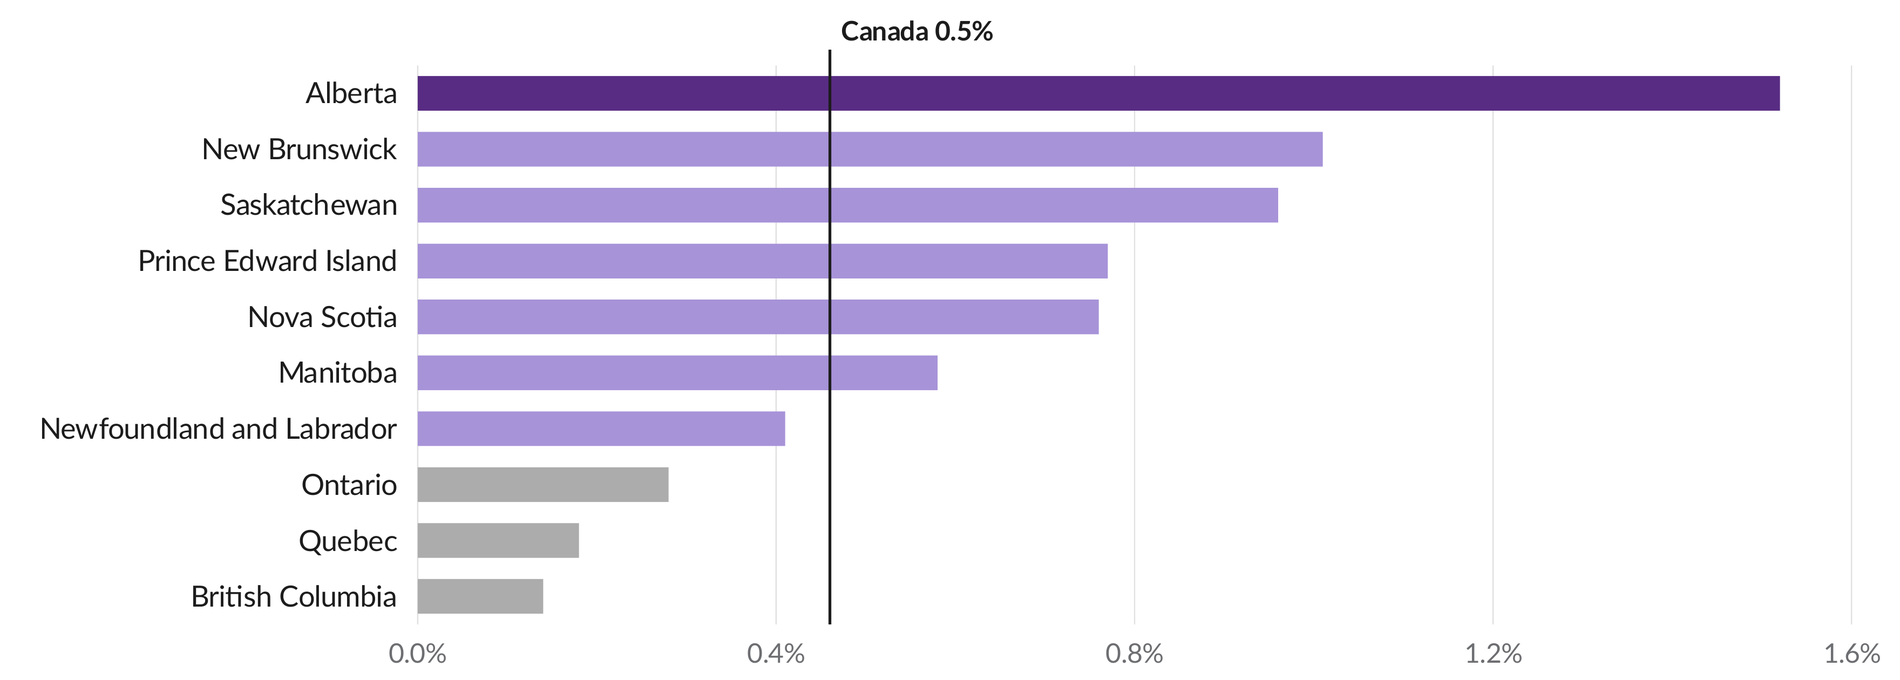
Population change by province, July 2025 to June 2026 (percent). The line marks the national rate of 0.5 percent.
Over the next five years, national growth is expected to reach 3.95 percent, led by the Maritimes and Alberta.
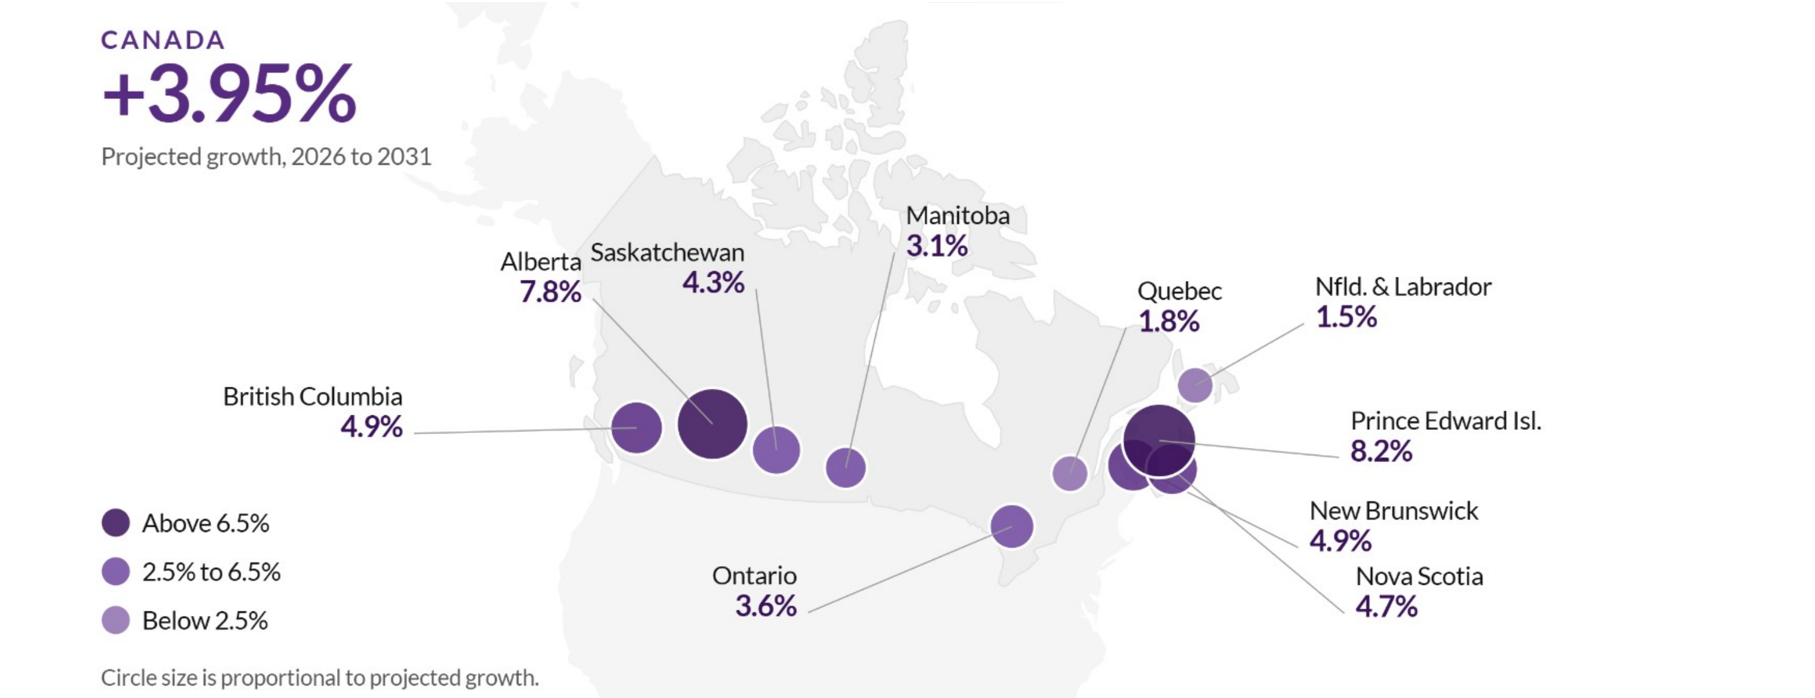
Projected population growth by province, 2026 to 2031 (percent). Circle size is proportional to projected growth.
Among metropolitan areas, Calgary (11.1 percent) and Edmonton (8.7 percent) are joined at the top by mid-size CMAs such as Moncton (10.8 percent), Lethbridge (9.5 percent) and Brantford (8.9 percent). Toronto (2.5 percent) and Montréal (0.8 percent) trail the national rate.
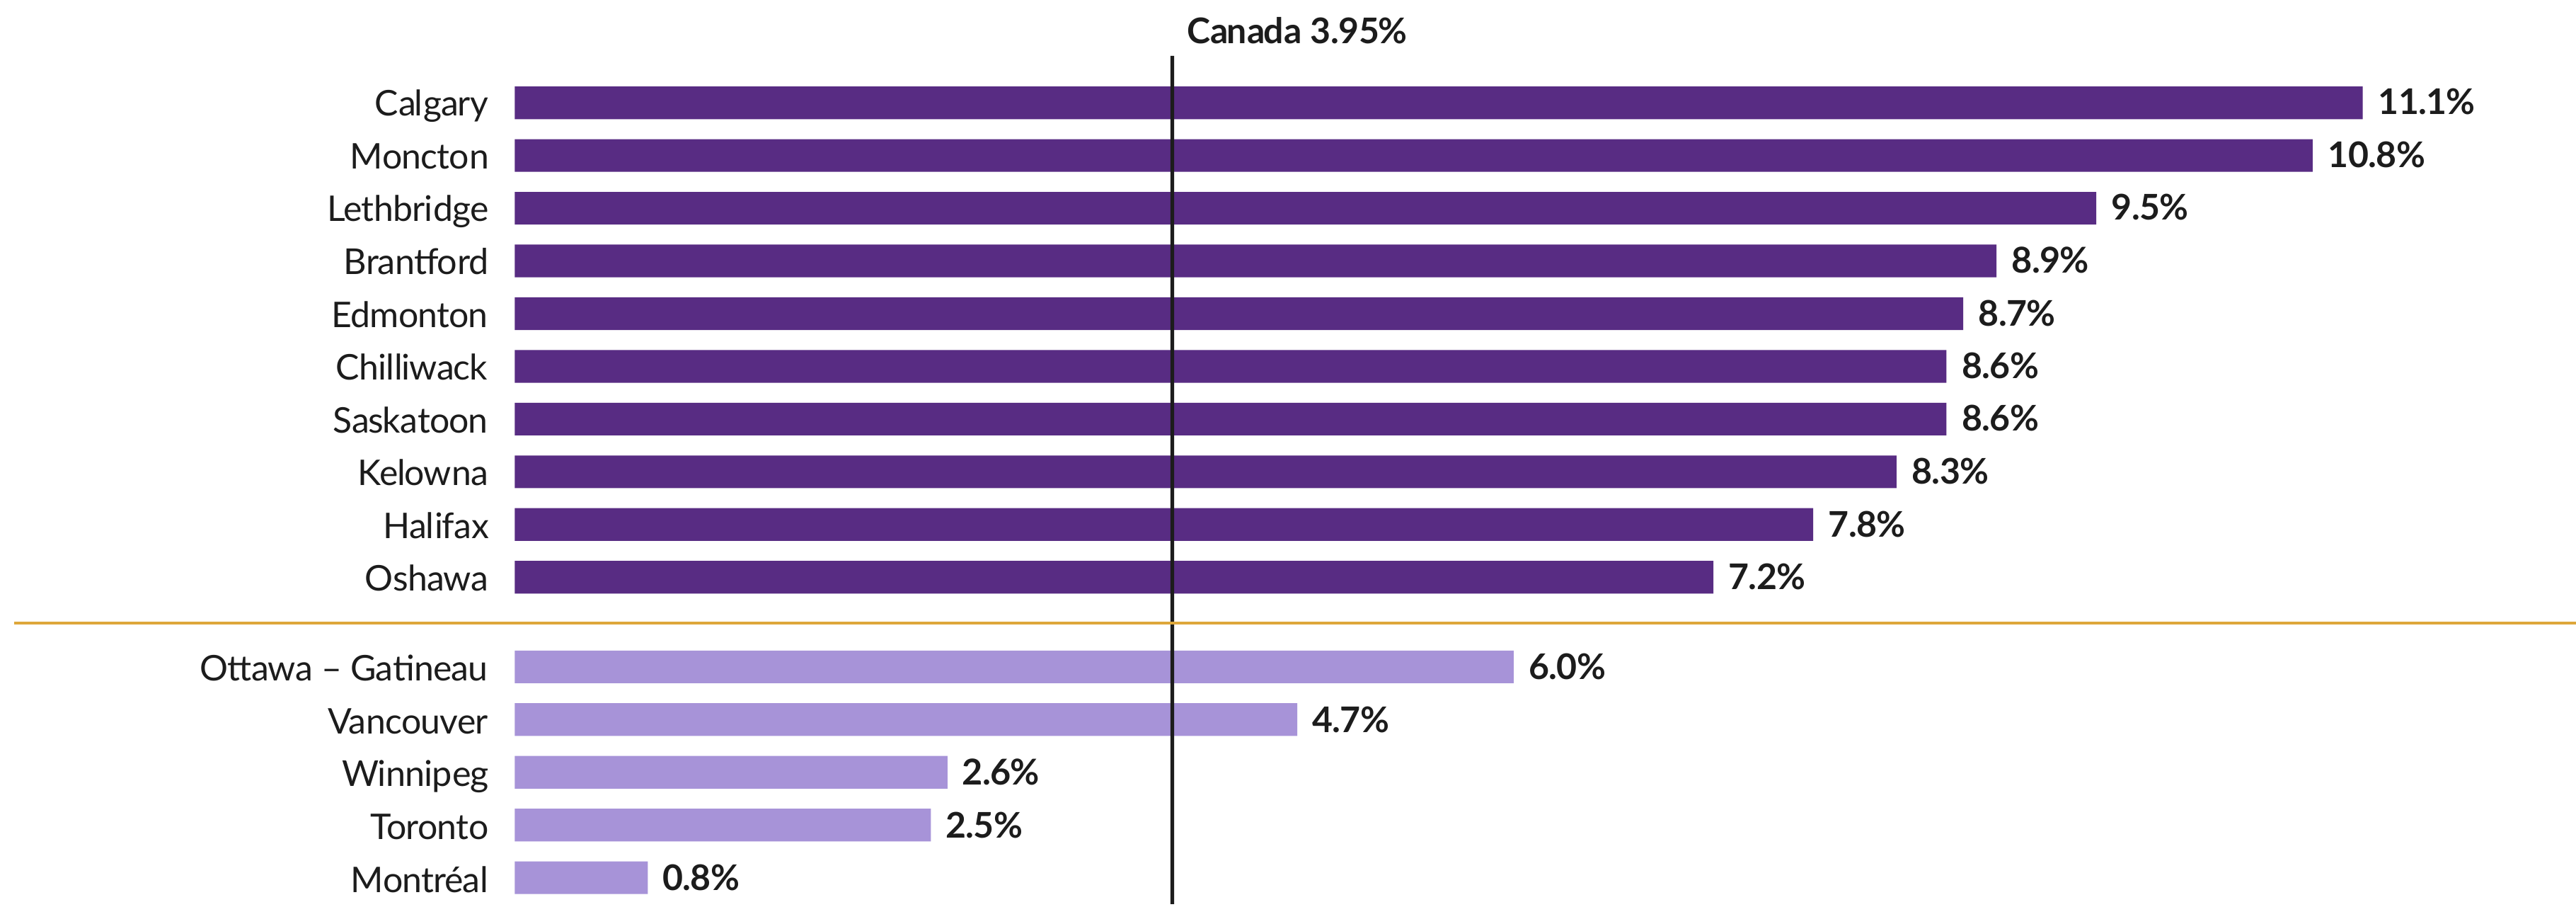
Projected population growth, 2026 to 2031 (percent): the 10 fastest-growing CMAs and the five other largest CMAs. The line marks the national rate of 3.95 percent.
Within each big market, growth is moving outward. Large-city cores are losing residents to the rings 0 to 200 kilometres away. The fastest-growing places to 2031 are small towns in those rings, such as Wasaga Beach, Ont., projected to grow 20.7 percent, more than five times the national rate.
Of the 1.7 million internal moves in a single year, between 41 and 54 percent of each mover group was 25 to 44 years old. It is a Millennial-led migration, with the oldest Gen Z close behind. For retailers, that points to exurban rings and second-tier centres that many national store portfolios are under-represented in, where drive-time catchments describe the market better than a simple radius.
Source: Statistics Canada; IRCC; Environics Analytics DemoStats 2026
An older, more diverse country, and a generational handoff
Canadians 65 and older make up 20.2 percent of the population today. By 2036, that share reaches 23.3 percent. The population 75 and older grows about 23 percent every five years while the child population shrinks, and by 2050 the population 85 and older will be 2.7 times its size today.
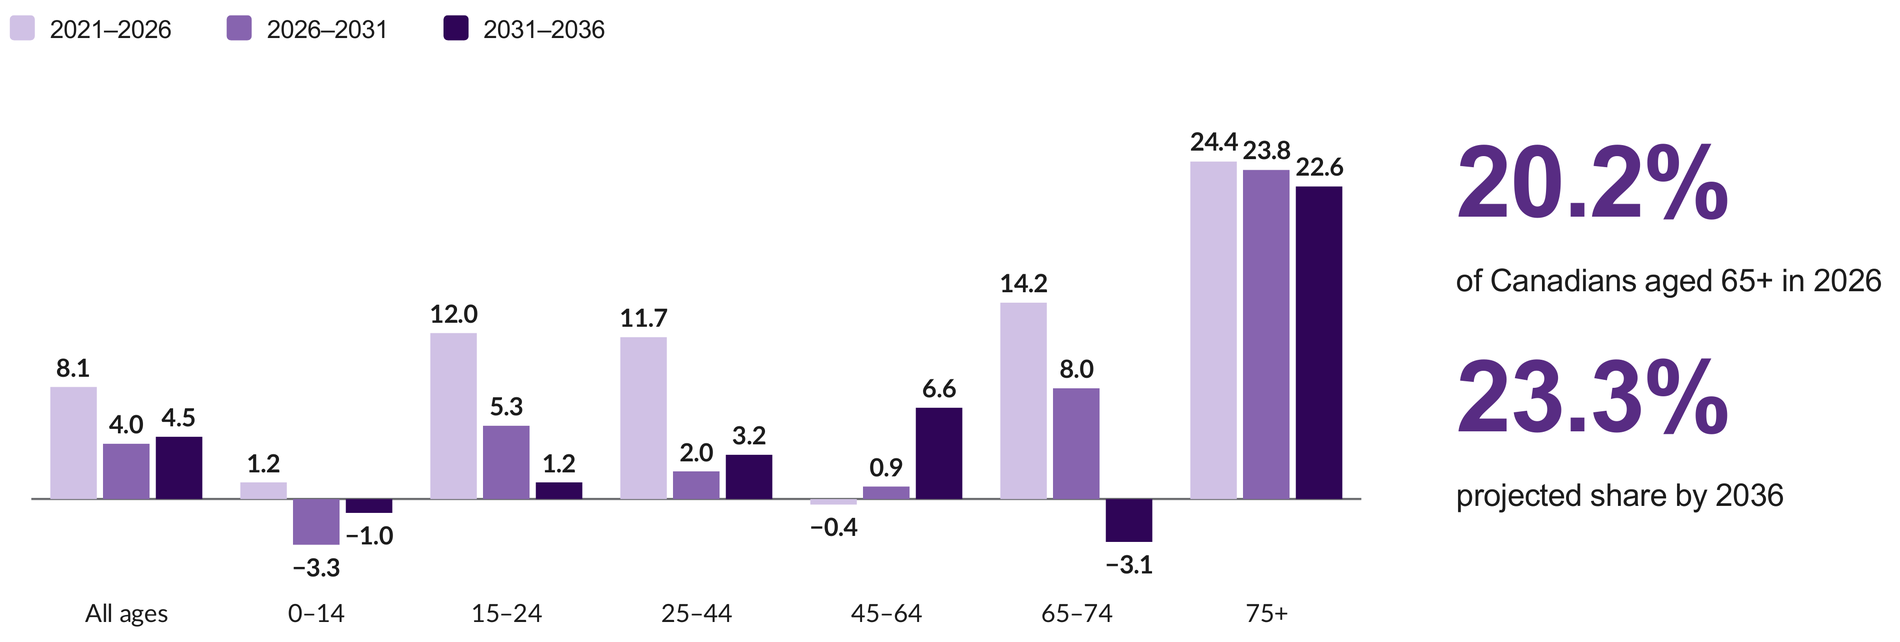
Population growth by age group (percent), five-year periods 2021 to 2026, 2026 to 2031 and 2031 to 2036.
Older Canadians are also changing how they live. If 2021 living patterns hold for each age group, senior households in high-rise rentals will grow 133% between 2026 and 2036, and those in owned condos 73%, compared with 23% for all senior households. That means smaller footprints, apartment-scale furniture and appliances, and delivery, installation and haul-away as part of the product. Seniors who stay put reinvest in accessibility and upkeep.
The mix of generations is turning over. Millennials now outnumber Boomers and are Canada’s largest generation. Gen Z is projected to take that position by the mid-2030s. Retailers must service the changing customer make-up, not just one side of it.
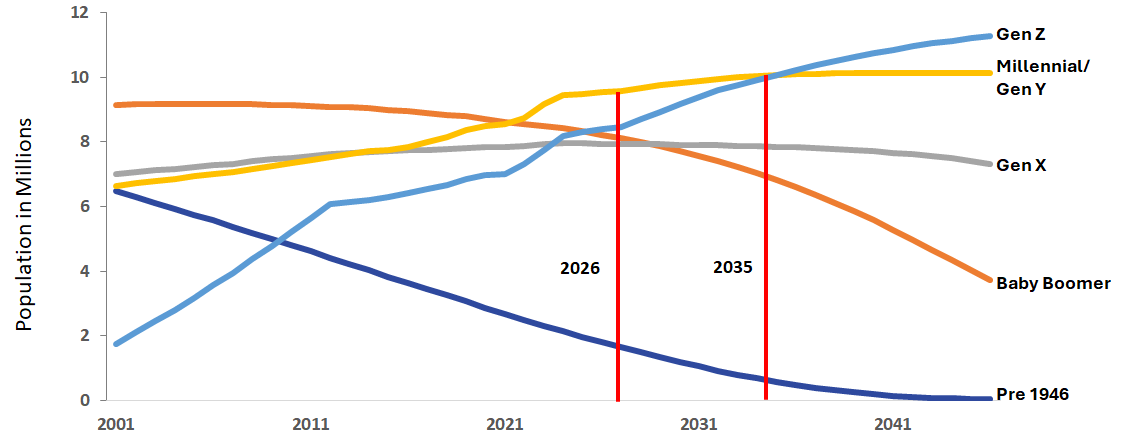
Annual population by generation (millions), projections. Red lines mark 2026 and 2035.
Spending power is following. Between 2020 and 2025, the Millennial and Gen Z share of Canadian net wealth rose by 10 percentage points, from 14 to 24 percent. Boomers’ share fell by 7 percentage points, from 44 to 37 percent.
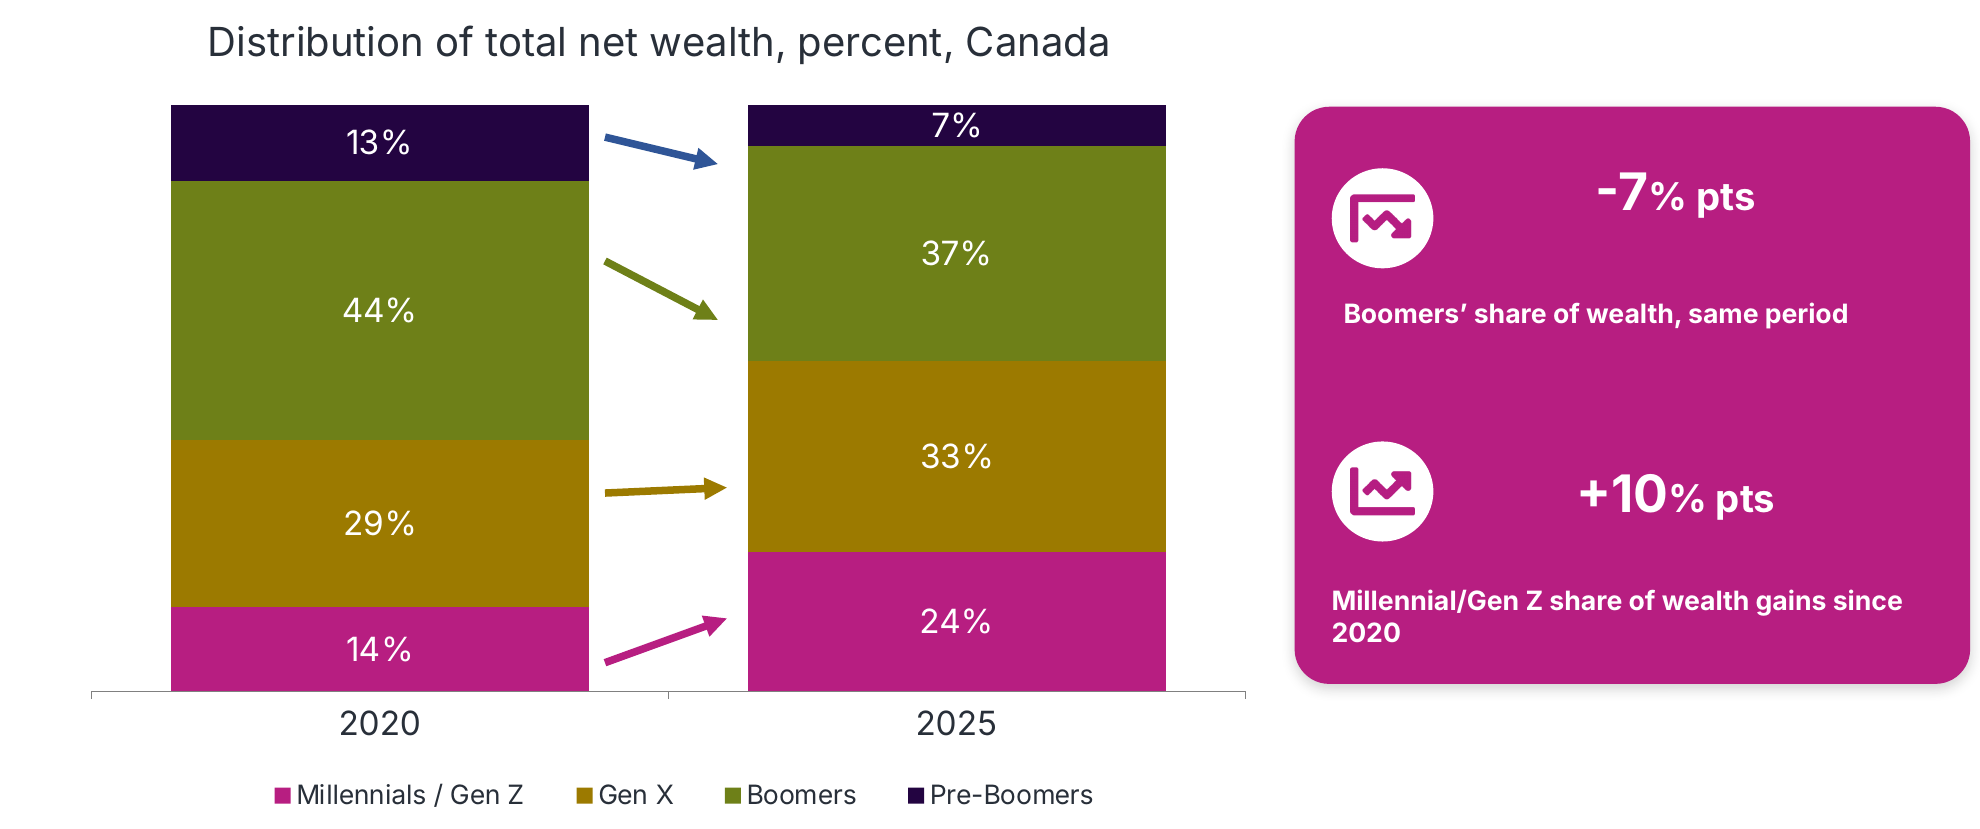
Distribution of total net wealth by generation, Canada (percent), 2020 and 2025.
Source: Statistics Canada, Household Economic Accounts; Statistics Canada 2021 Census and EA calculations; Environics Analytics DemoStats 2026
Four generations, four different wallets
Each generation sits at a different life stage, and household spending shows it. EA’s DemoStats 2026 and HouseholdSpend 2026 data put the differences in dollars.
| Generation | Average household income | Total spend | Where spend stands out |
|---|---|---|---|
| Gen Z | $104,000 | $337.6 billion | Highest share of spending on shelter (23.9 percent) and clothing (2.7 percent); lowest average spend on transportation ($8,871) and renovations ($3,103). |
| Millennials | $158,000 | $714.0 billion | Highest average spend on shelter ($32,294), education ($2,595) and clothing ($3,553). |
| Gen X | $175,000 | $386.0 billion | Highest household income; highest average spend on transportation ($16,654), renovations ($7,279) and recreation ($7,270). |
| Boomers | $126,000 | $468.7 billion | Highest share of wallet on renovations (5.0 percent), transportation (11.4 percent) and recreation (4.9 percent); lowest education ($1,227) and clothing ($2,590) spend. |
Source: Environics Analytics DemoStats 2026, HouseholdSpend 2026
Let’s take a closer look at each of these generations and how they are prioritizing.




Where generations differ, and where they do not
AI as the new front door. 45% of Canadian consumers now use AI tools in purchase decisions, according to an IBM consumer retail study, yet that has not replaced the physical store – 82% still look to the store as final mile. Shoppers use AI to research products, track deals and build shortlists. AI assistants summarize the content shoppers already look for online, such as customer reviews, expert picks and ideas. Generations do not use AI equally. Knowing who is using it helps retailers and brands publish the content AI assistants draw on and stay on the shortlist.
Discovery timing. Everyone still buys mostly in store. The difference is when the decision is made. Gen Z and Millennials decide what to buy before they reach the shelf, guided by TikTok, user-generated content and influencer-led search. Gen X and Boomers tend to compare at the shelf and research by talking to staff. Channel data back this up: Gen Z indexes well above average for researching and buying on mobile, and Millennials for buying on mobile, while Gen X and Boomers index below average for buying on mobile.
Speed versus service. Gen Z tends to want frictionless self-checkout. Boomers tend to want human assistance. The same store needs to be fast for one generation and staffed for another, sometimes even in the same aisle. Prioritization of who is in market or the category is where one wins.
Personalization versus privacy. Millennials expect personalization and are leading the way in using AI to get it, while 71% of Canadians expect retailers to anticipate their needs – spanning all generations. More than 80% would opt out of data collection if they could, 60% are concerned about sharing personal information with retailers, and only 9% would pay extra for personalized products. The retailers who get this right will lead with trust, not just technology.
Local and environmental credentials. Attitudes here are steady across generations. 56% of Canadians say buying local or Canadian-made matters, and 60% would pay more for an authentic, locally rooted product. What differs is the reason. For local products, Gen Z values ethical and environmental impact, Millennials prioritize support for small and independent business, Gen X wants quality and craftsmanship, and Boomers desire to give back drives trust and loyalty to Canada.
Source: Environics Analytics SocialValues 2026, Canada benchmark; Environics Analytics Opticks eShopper Powered by AskingCanadians™ 2026; Opticks Powered by Vividata; IBM consumer retail study
What this means for each function
Merchandising and Brand: Build for the local mix: project categories for Gen X owners, smaller-pack size lines for downsizing seniors, and separate planogram logic for self-serve and associate-assisted categories
Network and real estate. Follow the ring, not the core. Prioritize growing mid-size markets and smaller centres of growth, plan catchments on drive time, and screen sites on projected growth rather than historical growth.
Marketing and loyalty. Price gets you considered; value and values earn the sale. Lead with local, Canadian-made and sustainable messaging for the segments that will pay a premium for it, and trigger loyalty offers by who is in market. Price promotions alone will not build loyalty.
Social and content. Where shoppers discover products now depends on their generation: TikTok and user-generated content for younger shoppers, familiar channels for older ones. Plan one content calendar with two distribution strategies.
Digital and AI. Be the answer AI gives. Publish structured product data, reviews and project content that AI assistants can read, and track AI referral traffic against competitors. Build personalization against one consent standard for every generation. An AI layer cannot segment its way around consent and trust matters just as much as results.
Prioritize by design, not by default
Population growth in Canada has slowed, relocated, aged and diversified all at once, and each generation feels those forces differently. Serving all four does not mean offering everything to everyone. It means using data to decide where each trade-off matters most for your stores, brands and your trade areas.
Which of these trade-offs is your organization making by default, rather than by design?
Talk to our team to see how EA’s demographic and consumer data can sharpen your assortment, marketing and location decisions.
Related Content
Explore Opticks eShopper Powered by AskingCanadians™
Explore Opticks Powered by Vividata