COVID-19 Stay Home Order - A View into Canadians’ Compliance
To better understand where populations are still leaving their homes and who those populations are, we used our extensive data to analyze Canadian compliance with stay-at-home orders. Not surprisingly, across our diverse country, we see different rates of compliance. This knowledge can help identify who still needs to get the message, where they are and how to reach them.
Measuring the movement patterns of Canadians
To identify areas where the populations may not be taking the order to stay inside seriously enough, we used multiple databases to identify movement patterns, aggregate data to geographic levels and draw insights about the population.
Using privacy-compliant mobile data, we identified devices that were "Out-and-About" during the daytime for weekends from early February to early April, as the COVID-19 crises unfolded. We then aggregated the data to various geographic areas to understand the patterns at a national, provincial and market level.
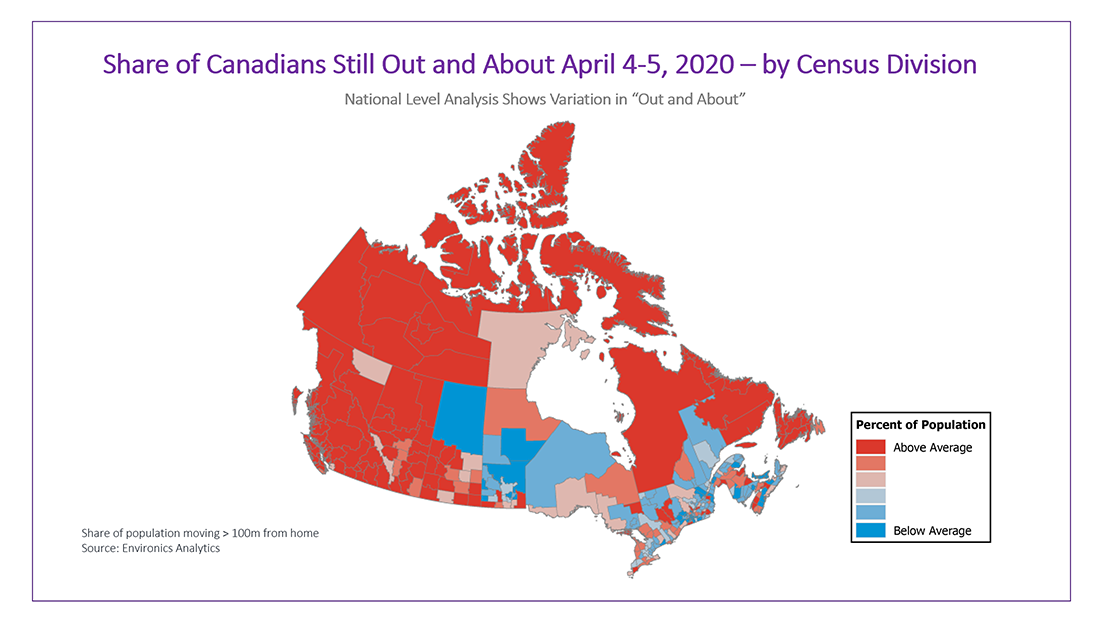
Share of Canadians Still Out-and-About April 4-5, 2020 - by Census Division [Map]

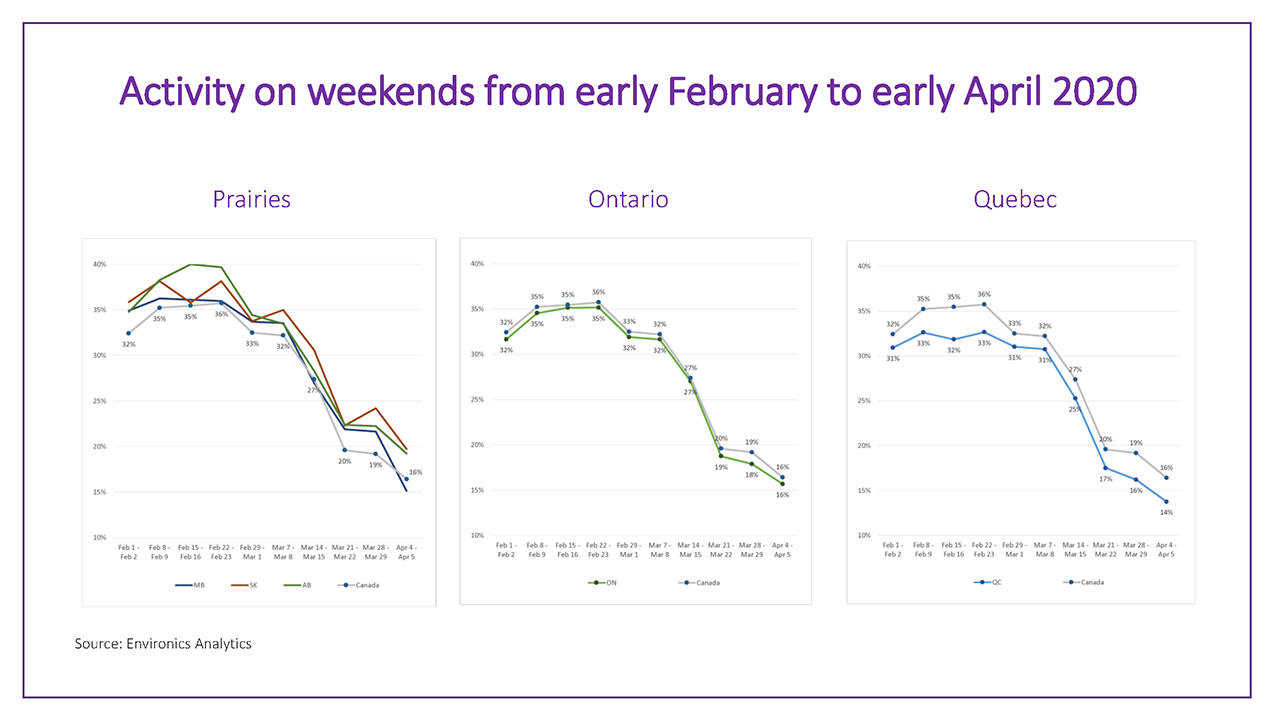
During the weekend of April 4-5, the Out-and-About rate was 16% nationally, down from 33% in early February before COVID-19 advisories were in place. The differences can be significant: Out-and-About rates tend to be higher in Western Canada and in Newfoundland & Labrador, while they are lowest in Central Canada. Saskatchewan had 20% of its population Out-and-About, while Alberta and British Columbia had rates of 19% during April 4-5. Quebec's rate was 14%.
Stay home compliance differs across our diverse country
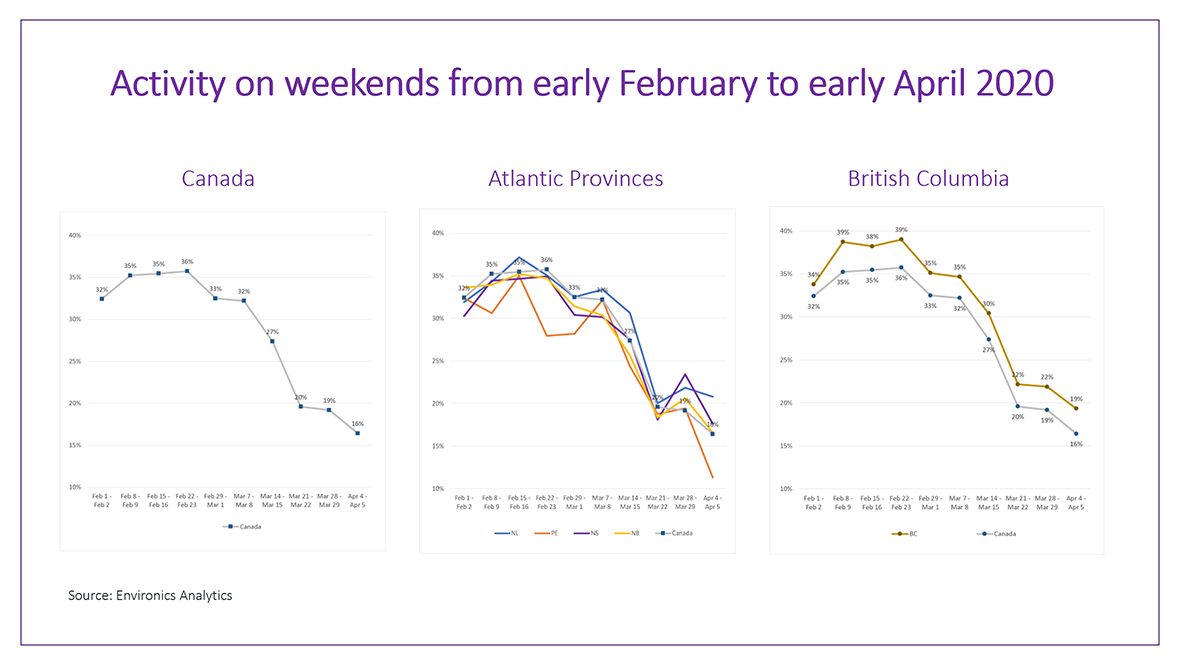
Through February, before the stay-home orders were in place, around 35% of Canadians were out-and-about from their home postal codes on any given day during the weekend. Those numbers started to fall in March as the COVID-19 crisis unfolded. By April 4-5, only 16% of Canadians were Out-and-About on either Saturday or Sunday.
All provinces showed significant drops in their Out-and-About rate through early April. But there are some important differences between East and West: British Columbia, Alberta and Saskatchewan tend to have higher-than-average rates– this was true before the crisis and continued through early April when stay-home orders were commonplace.
In Central and Eastern Canada, a smaller proportion of the population was typically out, both early on and later, with the exception of Newfoundland & Labrador where the COVID-19 crisis has had a smaller effect in keeping people at home.
Out-and-About activity on weekends from early February to early April, 2020 - by Province [Chart]


Who's Staying In, Who's Going Out During the Pandemic?
Governments have enacted a variety of orders, legislation, guidelines and enforcement measures which have contributed to getting large numbers of people to stay home. But further improving compliance will require more nuanced strategies targeted to specific populations who cannot, or will not, stay home.
We were able to identify clear socio-demographic patterns of who was more likely to go and who was more likely to stay home using our PRIZM segmentation system. This knowledge can help identify who still needs to get the message, where they are and how to reach them.
This is what we saw:
- Empty-nesters with higher Out-and-About rates as you move away from downtown cores.
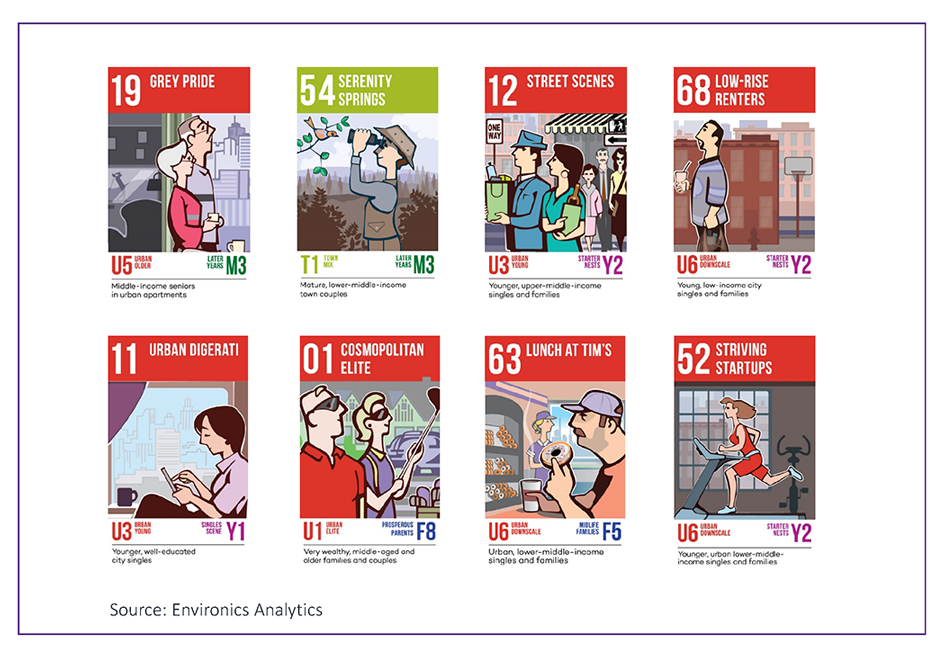
Two older PRIZM segments, 19 Grey Pride being a middle-class segment of retirees in urban apartments, and 54 Serenity Springs being a small-town segment of lower-middle-income retirees are both more likely to have the co-morbidities of concern for COVID-19. The key difference is that 54 Serenity Springs is much more likely to be Out-and-About (well above 19 Grey Pride, and the overall Canadian average) which is a concern given their health propensities.
Messaging Insight: Health promotion efforts to this group would likely not be effective via social media, but community-based approaches might reach them.
- Lower-income residents are out and about more.
68 Low Rise Renters lower index on the psychographic "Effort Toward Health" could mean that physical distancing is taken less seriously, but they are also less likely to be able to work from home as they are more likely to be in food, retail and other service jobs.
Messaging Insight: A better understanding of their circumstances could help reach them to ensure they know how to take precautions.
- Lower-income, urban segments are less likely to be responsive to "top-down" messaging telling them what to do.
Messaging Insight: Other approaches need to be explored to get the message through around physical distancing and staying home.
- Age is not necessarily a key differentiator.
Recent news reports specifically showing young people congregating in public spaces, putting themselves and others at risk of infection. Our data indicate that urbanity and socioeconomic status may matter more on Out-and-About rates than age.
PRIZM Segments used for Out-and-About Analysis

Environics Analytics' PRIZM segmentation approach classifies every residential postal code into one of 68 lifestyle segments, each with its own comprehensive socio-demographic, behavioural and psychographic descriptor.
Keeping Canadians inside will continue to be critical to the public health response
Data analysis can continue to help public health officials identify where Canadians are following stay inside regulations, and more importantly, where they are not. But identifying where they are is only part of the solution. Just as important is developing the insights into who these populations are and how to motivate them to stay home.
That means taking advantage of privacy-compliant demographic, financial, behavioural and psychographic data to help profile different consumer segments across the country and identifying the various attributes that can be leveraged to help these residents protect themselves. Governments have enacted a variety of orders, legislation, guidelines and enforcement measures which have contributed to getting large numbers of people to stay home. But further improving compliance will require more nuanced strategies targeted to specific populations who cannot, or will not, stay home.
Let's hope for continued improvement.
Click here to see the full analysis featured in the Globe and Mail
__________________
All maps and graphs Are EA generated. To learn more about the data used in the creation of this post or to ask a question about your specific situation, get in touch. We're ready to help.
Environics Analytics' Databases used in the analysis:
- MobileScapes
- DemoStats
- PRIZM
- Social Values
- Opticks Social Powered by Asking Canadians
- HouseholdSpend
- Canadian Community Health Survey (modelled to DA by Environics Analytics)


