

Travel and Tourism

Go the extra mile and take your brand to new heights
With a wide range of customized applications such as visitor profiling, customer journey analytics and predictive modelling, we have the expertise to help you build customer satisfaction, loyalty and advocacy. Whether you are a resort, destination, cruise line or the department of tourism, data analytics can help you exceed your visitors’ expectations and elevate the guest experience.

Gain a deep understanding of your guests and visitors
Profile your visitors to find your best audience, their interests, lifestyle and wealth and then discover how to find travellers just like them. Understand where they travel, how much they spend and which activities they engage in while on vacation. Analyse their behaviour, leverage survey data, uncover purchase drivers and determine the optimal mix of products and services.

Improve ROI on media spend and campaigns
Uncover key insights to differentiate your brand messaging based on what your guests value the most. Then engage them with more effective marketing messages and personalized offers to increase visitorship and bookings. Maximize your return on traditional and digital media spend by targeting your audience in the channels they prefer and frequent most often.

Build partnerships and evaluate sponsorship opportunities
Understand your target audience to identify partnerships and sponsorships that align to your brand. Create segments based on common characteristics to determine who to target and how to reach them. Using mobile analytics, you can also maximize your sponsorship impact by enhancing what you know about visitors who attend festivals, tourist attractions, or other ungated events.
-
 “Environics Analytics has fundamentally changed how we market to our member’s clients. The insights, data and inspiration from our partnership are immeasurable and Environics have become a part of our corporate DNA.”
 -
 “The depth and breadth of data available to us through Environics Analytics has allowed us to glean detailed depictions of the demographics, behaviours, and interests inherent to our guests and fans.”See the Case Study keyboard_arrow_right
 -
 “No-Hassle Travellers’ are 93 percent more likely to visit New Brunswick than the average Canadian Household. We never would have known this before.”
We Know Data
Enhance your data with our privacy compliant, authoritative databases. Choose from over 60 databases including segmentation, demographic, psychographic and behavioural data. Here are a few of our popular databases that support the needs of the travel industry.
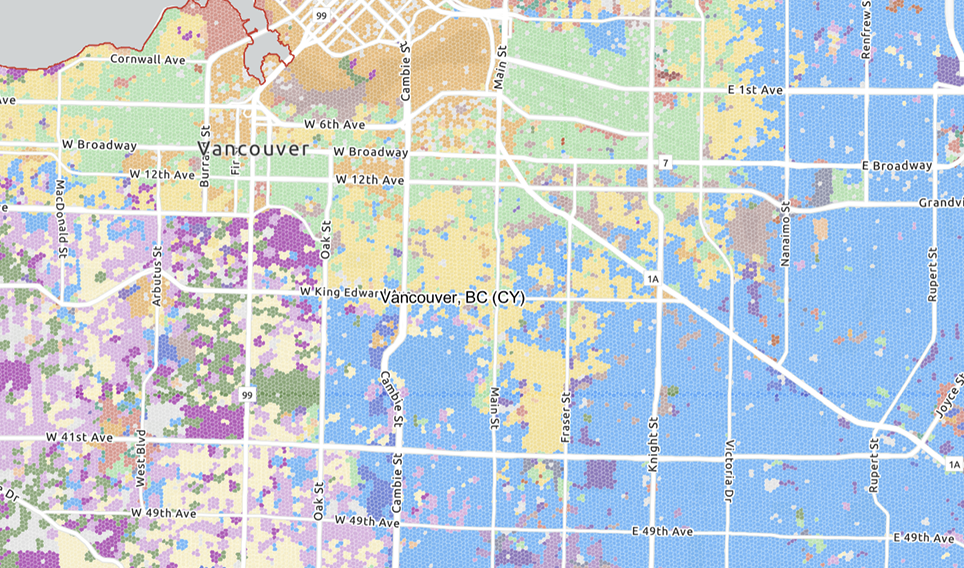
PRIZM® segments Canada’s neighbourhoods into 67 unique lifestyle types and incorporates data from nearly a dozen demographic, marketing and media sources to help you better analyze and understand your guests and visitors.
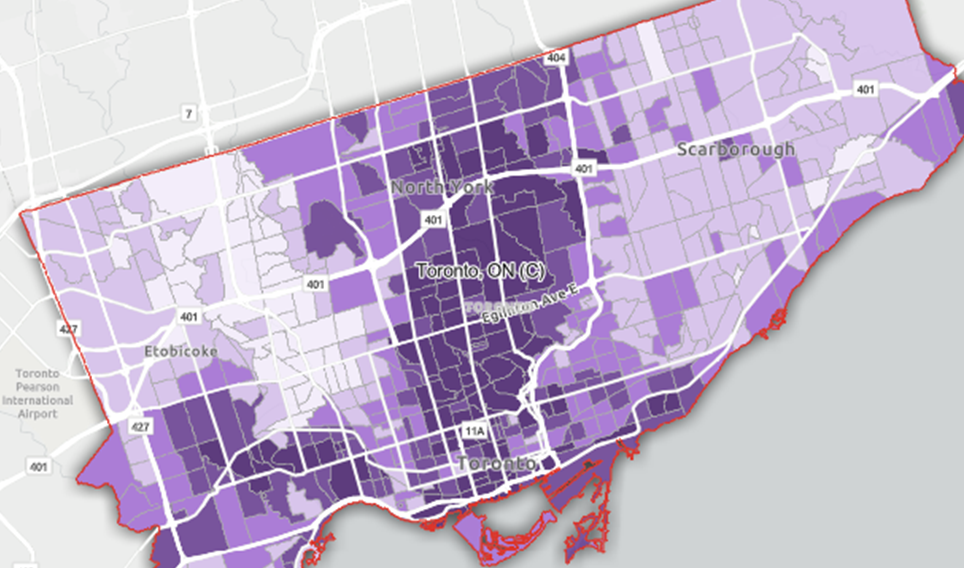
Using DemoStats, perform demographic trend analysis to create segments based on shared characteristics. With SocialValues, understand your customers’ mindset, what matters to them and how it affects their purchase decisions.
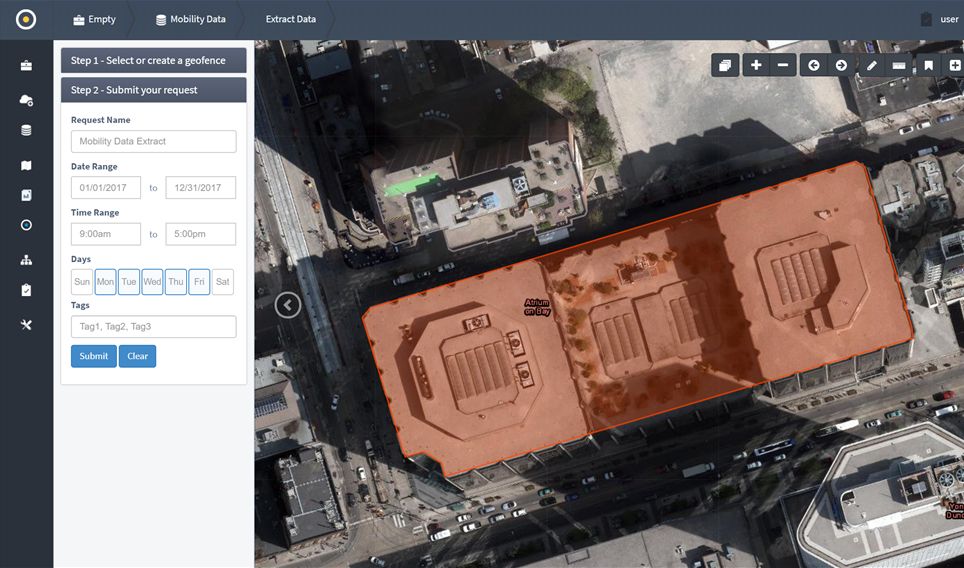
Enhance what you know about who attends events, festivals, tourist destinations, attractions etc. Mobile data can be instrumental in determining if the events you or your partners sponsor attract visitors that match your target.
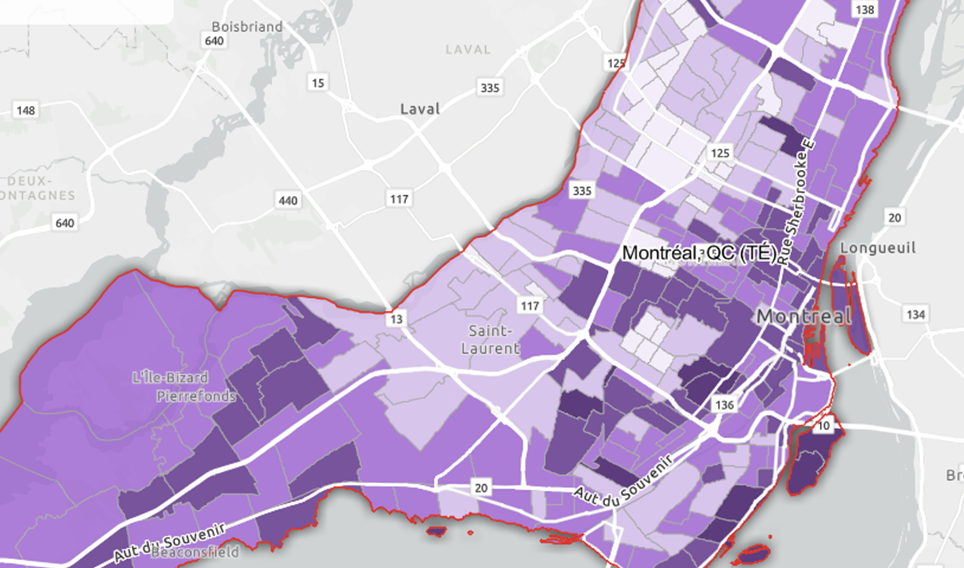
Through the range of Opticks behavioural databases, you can better understand your audience’s travel behaviour including the channels they use for bookings, where they prefer to stay and how long they will visit.
Want to know more about our Products and Services?
Get in touch. We're ready to help.
Frequently Asked Questions
Destinations, hotels, restaurants, tourist attractions can use mobile analytics to develop consumer profiles by creating benchmarks and understanding who visits their location versus their competitors’ location. This helps provide a better understanding of where your visitors likely live and work, what their interests are, what attractions they visit and and who your real competition is. See mobile analytics
Mobile analytics can enhance what you know about who attends events, festivals, tourist destinations, attractions etc. It can be instrumental in determining if the events you or your partners sponsor attract visitors that match your target.
Mobile data is an anonymized, permission-based data service, which uses data collected from location-enabled devices that were observed within a geofenced area defined by latitude and longitude. Our mobile data is collected only if consent is provided by the individual. See mobile analytics
Using segmentation and behavioural databases, you can understand the travel habits of different visitor segments and understand where they like to go, how much they spend and which activities they participate in while on vacation. You can then increase visitorship and tourism dollars by defining the right segments to target, understand their behaviours and create targeted messaging sent through the optimal channels. See consumer insights
By combining your visitor data with our privacy-compliant databases, you can gain deeper insights into who your visitors are, where they live and which travel and leisure activities are important to them. These personas can be used to segment your customer base and through market studies and area reporting, you can determine the optimal mix of products and services for a specific location or region. See site location intelligence
We take privacy, compliance, and data governance very seriously, and we are very proud of receiving favourable SSAE CSAE 3416 SOC1 Type II ,SOC2 Type II, and HIPAA/HITECT audit reports after rigorous, independent reviews of our internal security controls. The reports represent certification with programs such as CSAE 3416 (Canadian Standard on Assurance Engagements (CSAE) 3416), AICPA (American Institute of Certified Public Accountants) and HIPAA-HITECH.
In addition, the source data used as inputs to our product development are 100 percent privacy compliant. Any personal information provided to us by clients is used solely for the purposes of their business and is safeguarded in client-specific, firewalled locations in secured data centers. We also ensure that our compliance policies for Canada and the U.S. are consistent with the E.U.'s General Data Protection Regulation (GDPR). See our databases
Meet our Travel and Tourism Practice Team
Our consultants have the strategic expertise and sector experience to help address your key business challenges. Many of our clients work with us as a seamless extension of their team and think of us as their competitive advantage.

Larry Filler
Senior Vice President & Practice Leader
Larry Filler helps organizations realize value from data. He has more than 30 years of experience in developing and applying analytics solutions for clients across many industry sectors, including technology, financial services, retail, automotive, packaged goods, loyalty, travel and not-for-profit. Larry co-founded the Boire Filler Group, an analytics consulting practice that was acquired by Environics Analytics in 2016. He began his career at American Express and later worked at the Loyalty Management Group and MacLaren McCann Relationship Marketing. A frequent speaker at industry conferences, Larry holds a Bachelor of Science degree in Economics from the University of Wisconsin and an MBA in Marketing from Schulich School of Business at York University.

Stan Ivankovic
Vice President, Business Development
As a Vice President of Business Development at Environics Analytics, Stan Ivankovic helps real estate and retail clients better understand their markets, trade areas and customers, tailoring projects, data and software engagements to meet the needs of each client. A veteran sales, training and product management executive, he spent 10 years at Xerox Canada, where he developed leadership and consultative skills. He earned a Bachelor of Arts degree at the University of Toronto, specializing in management and economics.

Jennifer Robins
Vice President, Business Development - Tourism Lead
Jennifer Robins is a dynamic business development executive with a proven track record in the tourism industry. As the Vice President of Business Development and EA's Tourism Lead, she leverages her extensive experience in market analysis, strategic planning, and partnership building to drive growth and innovation. Jennifer excels at identifying new market opportunities and developing tailored solutions to meet the unique needs of clients and stakeholders. Her exceptional leadership skills and ability to foster collaborative relationships have been instrumental in helping her clients achieve their goals. Jennifer holds an MBA from Hult International Business School and an Honours Bachelor of Arts in French and Marketing from the University of Guelph.
Why Choose Environics
We've got the expertise to help. With decades of leadership and experience in the industry, we are the only analytics firm in Canada to offer our broad range of privacy compliant, consumer and business databases, proprietary software and team of industry professionals.
Company Statistics
Awards and Recognition


Meeting the highest standards of data privacy and security


Travel and Leisure Industry Insights and Trends
Our industry experts publish timely analysis of government data releases, opinions on industry trends and insights on how organizations are embracing big data and analytics to help you stay informed.

Learn how Destination BC used mobile movement data to better understand their US visitors and how their plans to market to the US have changed since the start of the COVID-19 pandemic.
.jpg?sfvrsn=e0eebd17_1)
Understand the impact of COVID-19 on Domestic Overnight Visitors within Canada, its provinces, territories and tourism regions.

We used EA data to identify Canadian traveller patterns, understand who is travelling, where they live and where they are travelling to.
PRIZM is a registered trademark of Claritas, LLC.