MobileScapes ENVISION
Analyze large volumes of mobile movement data, quickly
ENVISION users can easily connect mobile movement data to EA's 20,000 data points to analyze changes and trends through the lens of various analytical databases such as Pop-Facts and PRIZM Premier. Quickly analyze and enhance high volumes of complex data to generate detailed visitor profiles, keep tabs on the competition and improve your site selection process. Compare activity week-over-week or versus the same time last year for a deeper understanding of population movement patterns. Link analysis to dashboards and generate custom reports to share key insights easily.
Generate results faster
Analyze large volumes of mobile movement data quickly
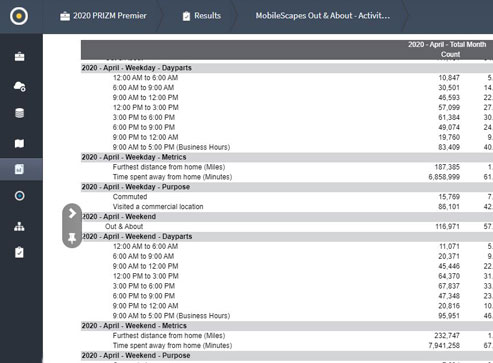
Access new trend reports
Complete trend analysis through the lens of databases such as Pop-Facts and PRIZM Premier
Change and trend analysis
Not using ENVISION, yet?
Learn about our powerful analytics platform
Analytics at the Speed of Change
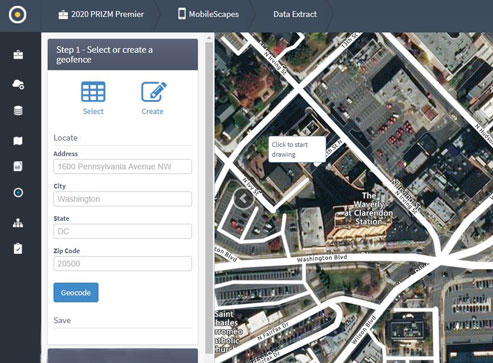
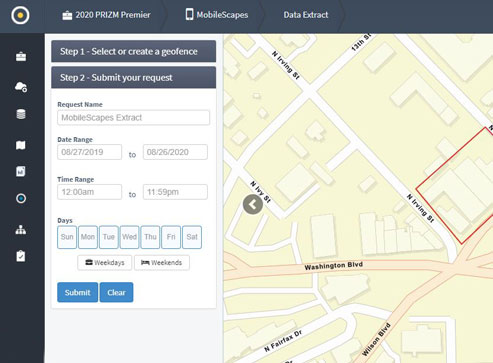
- Hand draw polygons or upload your own up to 5 million square feet
- Select the timeframe which can include specific days or dayparts
- Generate new MobileScapes Trend Reports for faster analysis of mobile movement data
Visit our community site to learn more about the MobileScapes database and the ENVISION analytics platform.
.png?sfvrsn=b3f787e9_6)
Analyze mobile movement data
through ENVISION's user-friendly interface
Access comprehensive mobile movement analytics with our intuitive dashboard that simplifies complex data visualization and reporting.
Ready to really understand your customers?
Learn how MobileScapes ENVISION can help your business
MobileScapes ENVISION FAQs
ENVISION is a powerful cloud-based consumer insight and market intelligence platform. Easily combine your data with EA’s databases to create workflows and mapping to generate a deeper understanding of your consumers, prospects and trade areas, anywhere in North America.
Mobile movement data are anonymized and permission-based data collected from location-enabled apps on mobile devices. The main sources of these data are opt-in location-enabled applications on mobile devices and ad exchange platforms. At present, there are approximately 100,000 mobile applications that contribute data to our MobileScapes services. Raw mobile movement data, at its most basic level, provides a unique and persistent, yet anonymous, device ID, along with a date, time, and latitude/longitude coordinates for each observation. We then take steps to ensure privacy such as summarizing the data to periods of time. All observed latitude and longitude coordinates are moved to the nearest ZIP+4 to ensure anonymity.
Researchers can then observe devices within a defined area such as a store, public square or on a roadway for a given date and time range. Common evening location (CEL) and common daytime location (CDL) are inferred according to where these devices are most frequently observed during the day and at night. When analyzed correctly, mobile movement data can help you understand who’s visiting your locations, where your customers are coming from, how often they return and where else they might be going.
Yes. MobileScapes data can be accessed via project work or as flat files for use in your business intelligence tools. This also allows you to monitor activity weekly or monthly.
Yes. Our mobile movement data are collected only if the individual provides consent or permission. Consumers can easily change their level of location sharing overall or for individual mobile apps via their privacy settings on their mobile devices. Depending on the individual app settings, device holders can decide if a particular app should share their location while in use or block that permission outright. We actively participate in industry and association conversations in these areas, creating policies that protect individuals and allow for the responsible use of data.
To learn more about our privacy efforts, read our privacy policy.