WorkplaceNow
A weekly view of workplace occupancy to assess the pandemic recovery across Canada
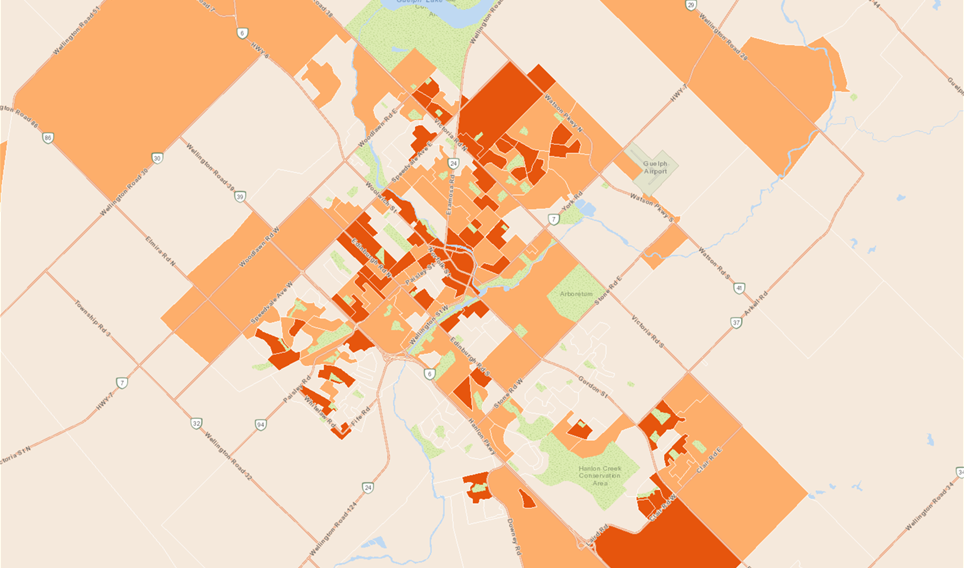
WorkplaceNow provides estimates of the number of workers and days worked at employment locations. Detailed estimates for all levels of Census geography, allow users to see trends in employment districts, cities, regions and user-defined geographies like trade areas. Current data can be compared with any other period, back to 2019 to put occupancy levels in perspective.
WorkplaceNow’s weekly data (updated monthly), help property managers know occupancy trends in their markets, give transportation planners vital information to forecast travel demand and help retail and restaurant businesses plan staffing where they cater to the workday crowd.
Estimates are based on privacy-compliant mobile movement data that capture the Common Daytime Locations of Canadians. Access WorkplaceNow in ENVISION for convenient reporting on the geographic areas you define, or as a flat file to incorporate in your own tools. When used with EA’s BusinessProfiles database, WorkplaceNow paints a picture of which industries are moving back sooner, which are moving back later, and which ones may see longer-term changes to workplace utilization.
Compare utilization patterns
Compare your property to other workplace areas and track patterns and trends
Plan retail staffing and inventory
Ensure the right locations have staff and products based on nearby workplace utilization
Plan transportation service
Match service levels to transportation demand based on office occupancy
Want to learn more about WorkplaceNow?
Answer key workplace questions
• What share of workers have returned to workplaces?
• How many commuter trips happened in a specific week to the vicinity of a transit station?
• Which areas have the least utilized workplaces?
• Which of my locations have the most workers in the vicinity compared to 2019?
• What is the average number of days per worker onsite in a week?
• Which of my locations are trending up in terms of occupancy?
• Which of my locations are not increasing in terms of occupancy?
More Data to Choose From
Enhance your data with our privacy-compliant, authoritative databases. Choose from over 60 databases including financial, demographic, segmentation and behavioural data.
PRIZM® segmentation classifies Canadians into 67 unique lifestyle types to help you better analyze and understand your prospects and customers.
MobileScapes helps you to identify who is visiting your locations. Understand where your customers live, work and how often they visit.
DemoStats features variables, including both averages and distributions, on population, family structure, household size and type, ethnic diversity, labour force participation and income.


