


 FootFall
Weekly visit metrics to thousands of locations using Canada's highest quality mobile movement data
FootFall helps you effortlessly trend and compare visits to your locations and those of your competitors. Our weekly updates use de-identified, normalized, aggregated and/or anonymized mobile movement data from cellular network signals, combined with our proprietary geofence library. Environics Analytics’ (EA) advanced models calibrate the observed data to represent the full Canadian household population aged 15 and older. FootFall covers most retail stores, businesses, business improvement areas and recreational locations across Canada. With FootFall, you can easily monitor estimates for individual locations and entire retail banners.
The 2026 vintage of FootFall is built on a redesigned data engine and features a new and improved dashboard, available in ENVISION and/or externally as a standalone application, making it simple to access the information you need.
Assess how a customer base is changing over time, how new competitors in the market impact foot traffic patterns or the effectiveness of targeted marketing initiatives.
Whether you’re focused on competitive analysis, network planning or marketing, FootFall empowers your decision-making with simple, convenient and regularly updated KPIs on visit traffic for the locations that matter most to you. For deeper consumer and trade area analysis, our suite of products is there to help alongside FootFall, including MobileScapes, DemoStats, PRIZM® and more. FootFall is a critical part of the analytical toolkit used by businesses, not-for-profits and government organizations across Canada to gauge location performance.

Track visits
Identify which locations have the most or least visits and how they are trending over time. Identify banner and category trends and seasonal impacts.

Compare visit shares
Understand whether your share of total category visits is going up or down to assess competitive impacts.

Evaluate marketing impact
Measure the impact of your marketing—or your competitors’—based on volume of visits, demographic and PRIZM® insights.
Want to learn more about FootFall?
Get detailed dashboards and reports
The new and improved FootFall dashboard offers a smoother, flexible and more modern experience for accessing and unlocking foot traffic insights. The dashboard is embedded in ENVISION and can also be accessed externally for non-ENVISION users.
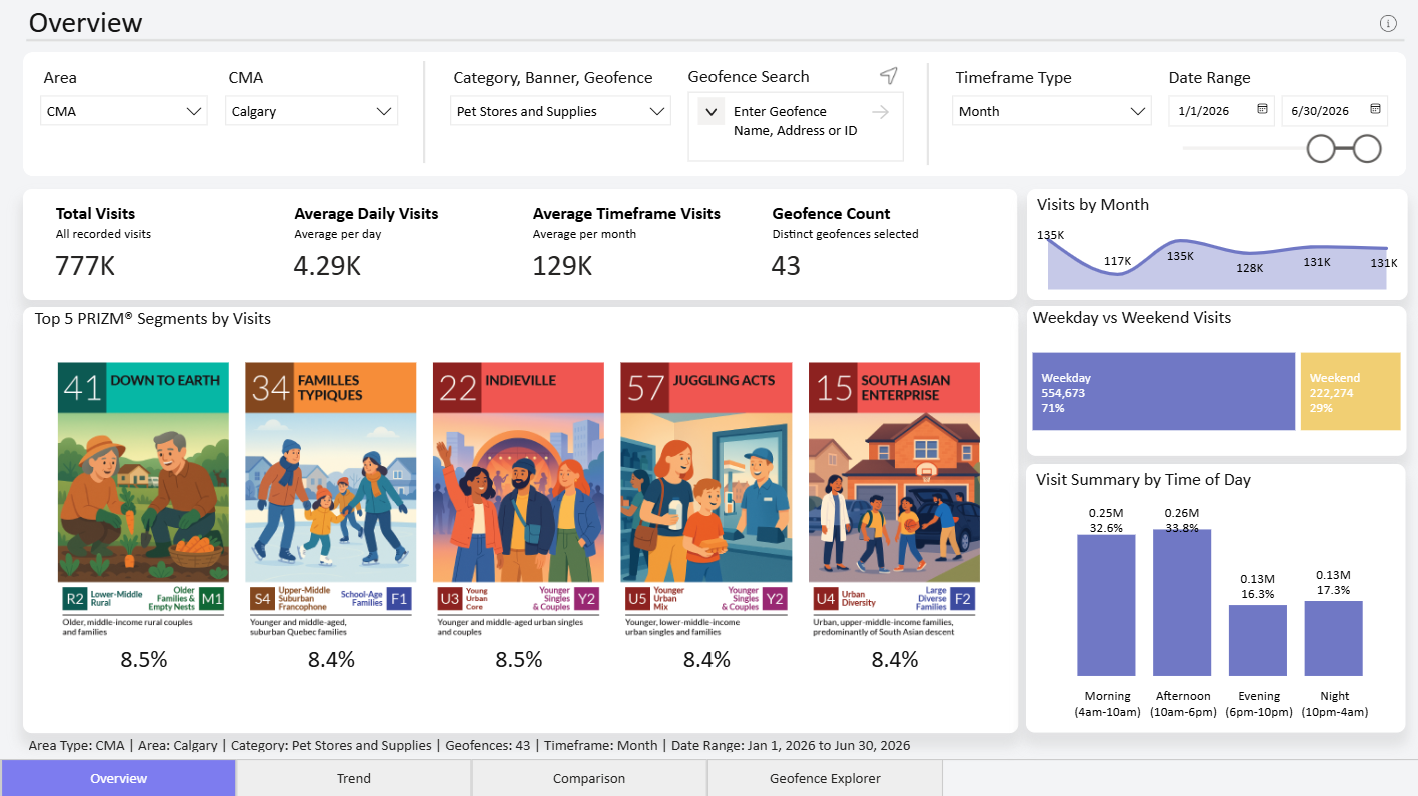
The Overview page provides high-level KPIs, visit distribution trends, and a ranked breakdown of top PRIZM® segments.
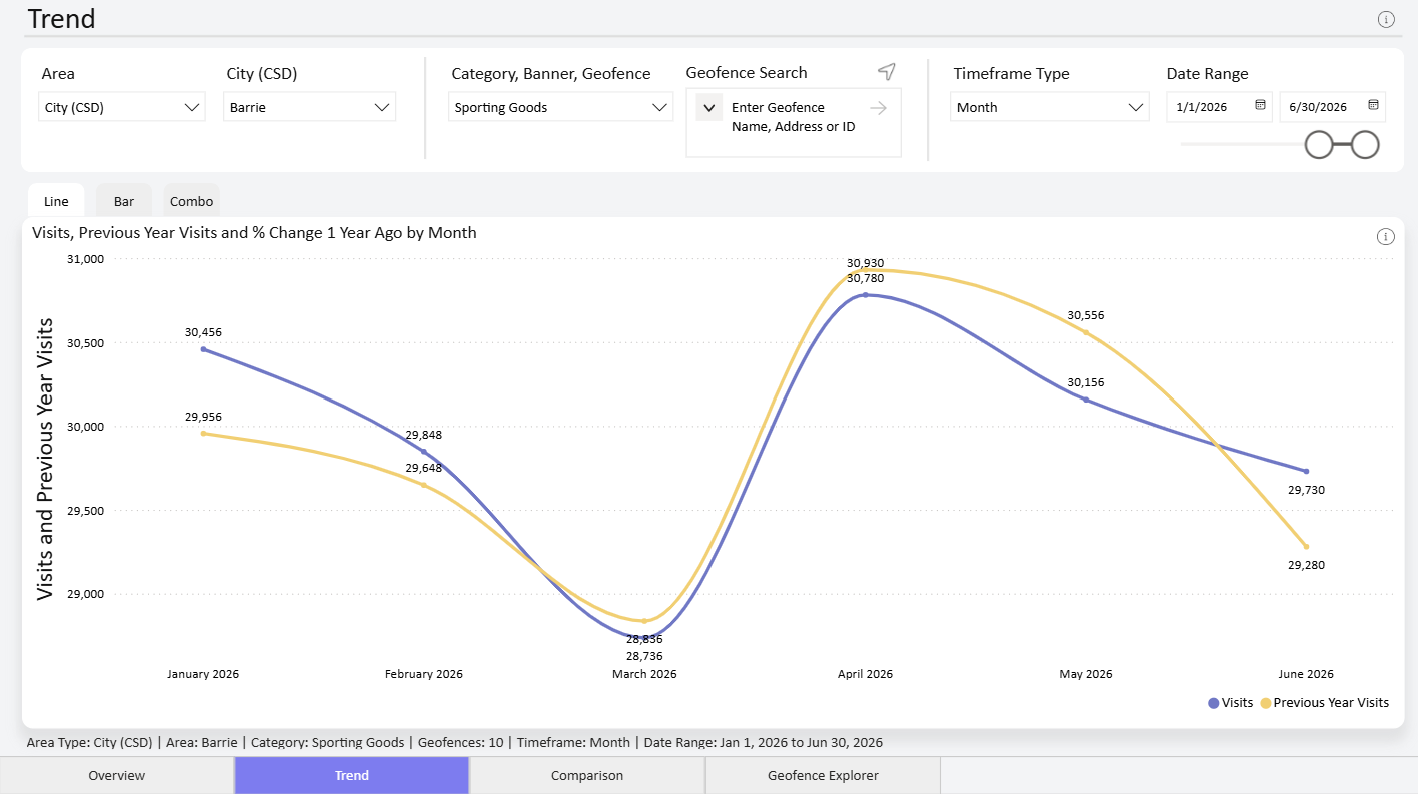
Track total visit volumes over time with year-over-year comparison.
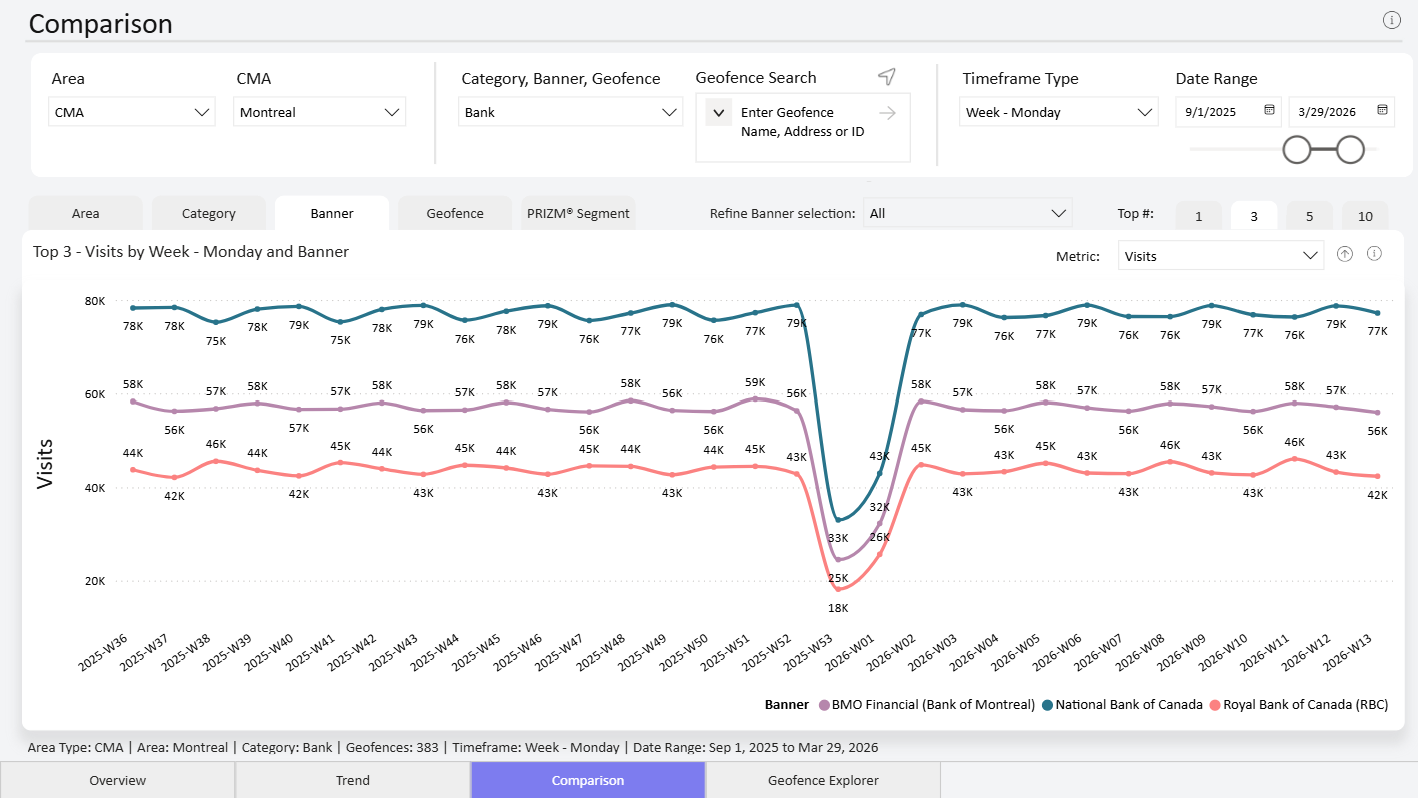
Compare markets, categories, banners, geofences, or visit PRIZM® segments.
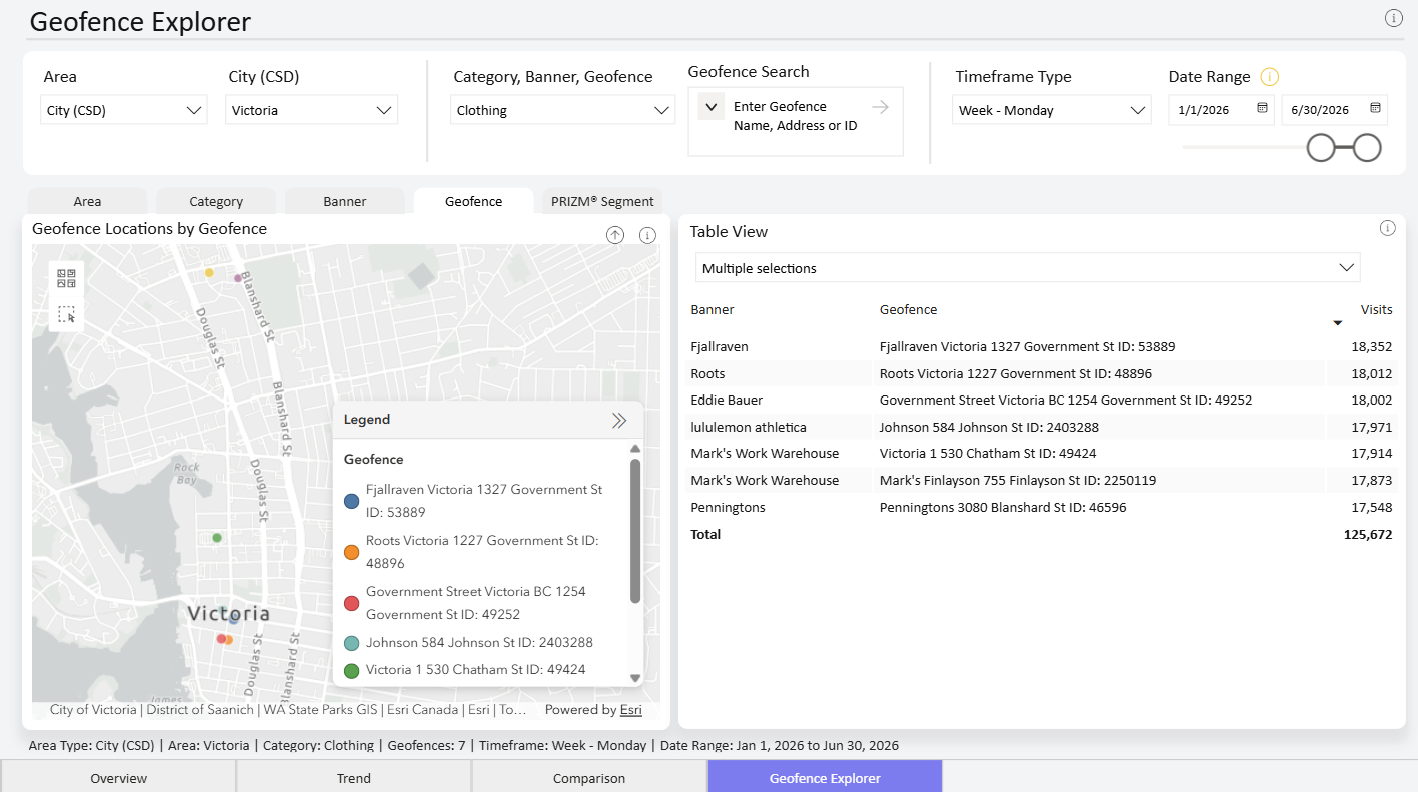
The new Geofence Explorer allows for map-based spatial exploration of individual geofences with visit counts and segment overlays. Customize your table of geofences and map view.
Answer key location visit questions
- How do visits to my store compare to that of my competitor’s?
- When are our busiest shopping periods?
- Are we gaining or losing market share over time?
- Which regions are most competitive?
- Which PRIZM® segments make up our customer base?

More Data to Choose From
Enhance your data with our privacy-compliant, authoritative databases. Choose from over 60 databases including financial, demographic, segmentation and behavioural data.
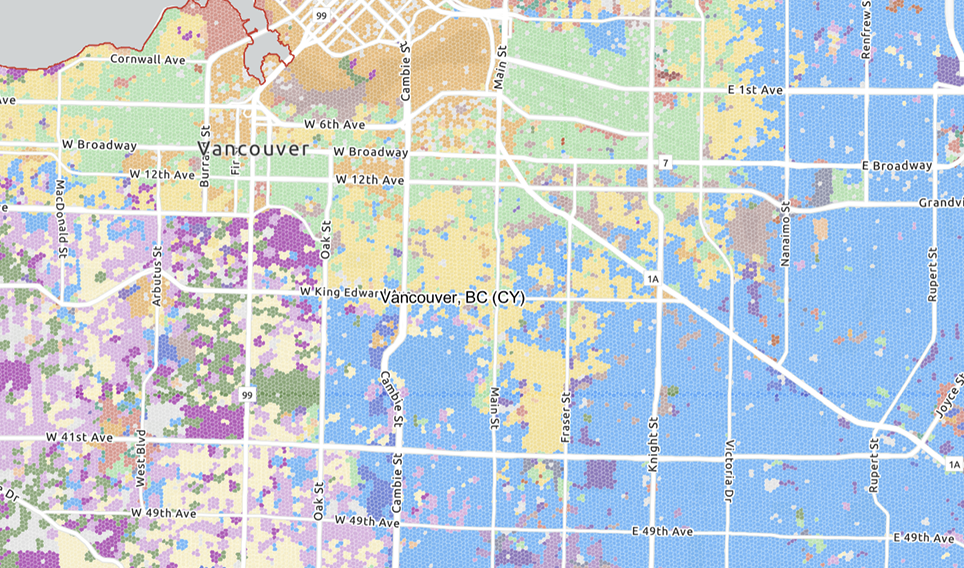
PRIZM® segmentation classifies Canadians into 67 unique lifestyle types to help you better analyze and understand your prospects and customers.
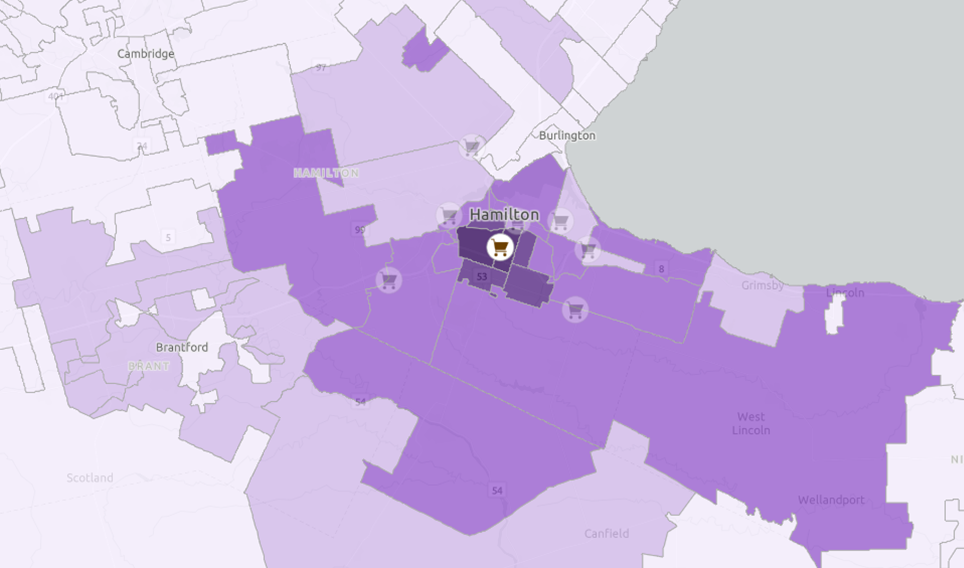
MobileScapes helps you to identify who is visiting your locations. Understand where your customers live, work and how often they visit.
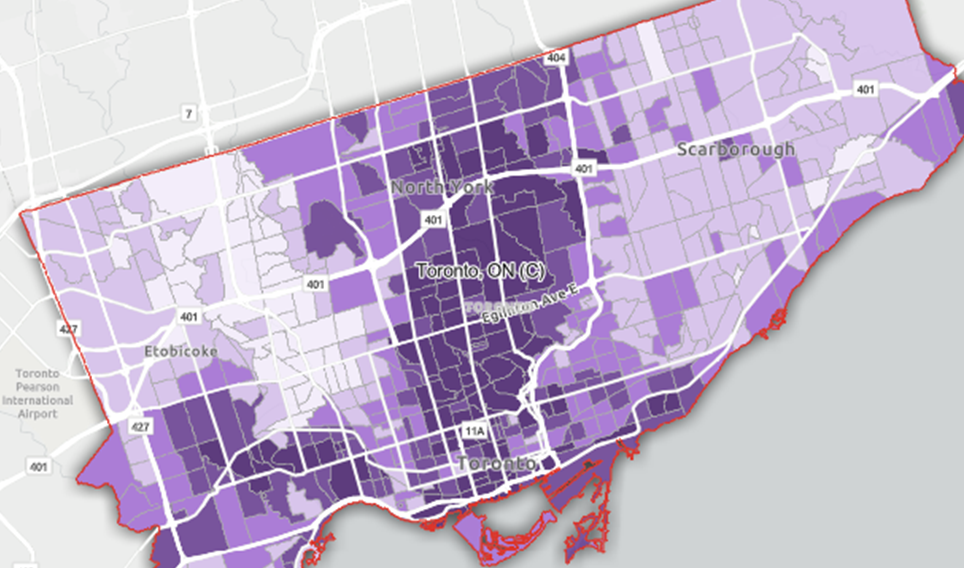
DemoStats features variables, including both averages and distributions, on population, family structure, household size and type, ethnic diversity, labour force participation and income.
PRIZM is a registered trademark of Claritas, LLC.